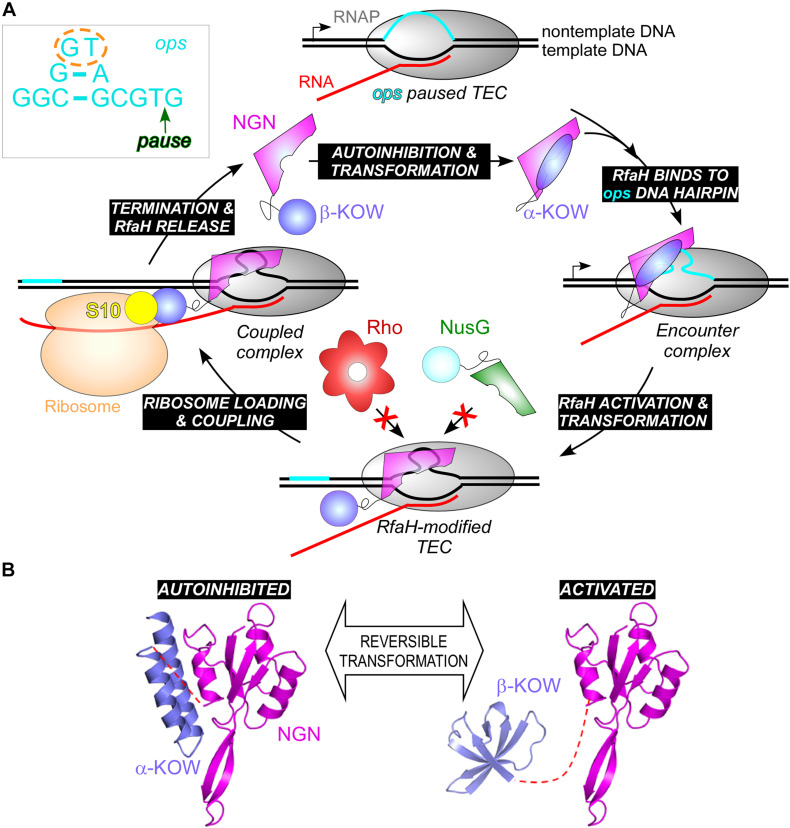
FIGURE 9.
(A) A full cycle of RfaH; see text for details. The inset shows the ops DNA element, which forms a short hairpin on the TEC surface; ops bases that make most interactions with RfaH in the complex are circled; the pause position is indicated by an arrow. (B) RfaH domain dissociation and refolding. PDB IDs: autoinhibited RfaH, 5OND; activated RfaH, 6C6S.

