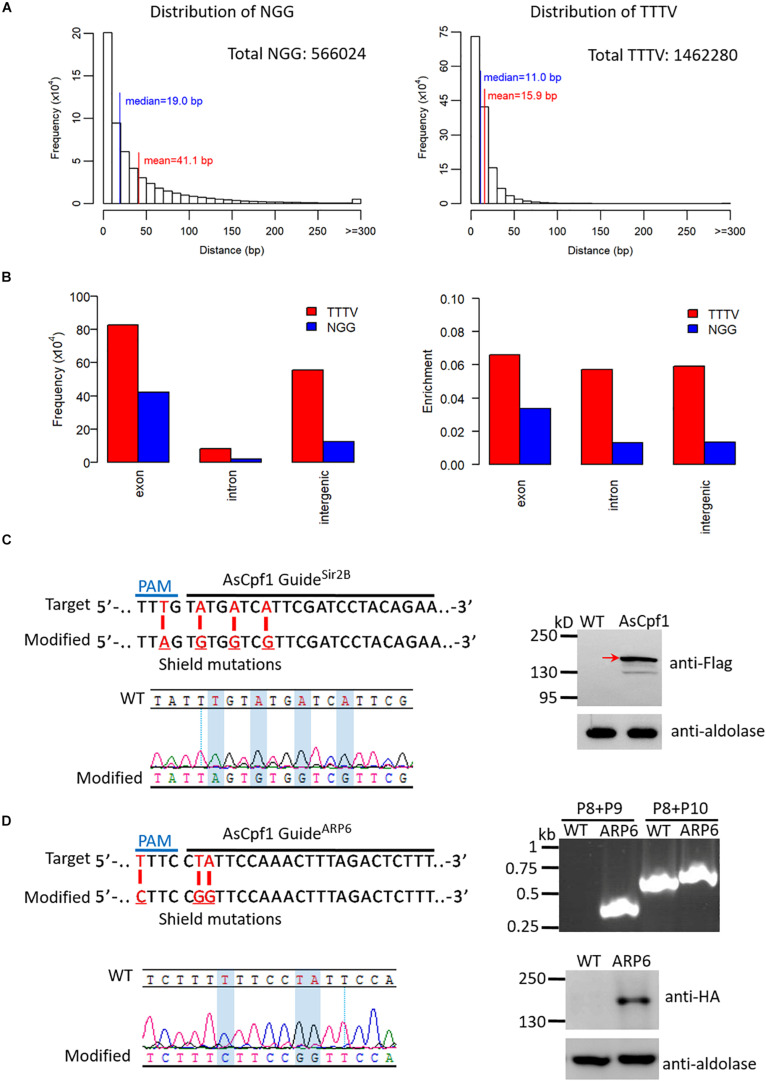
FIGURE 4.
Adaptation of AsCpf1 in P. falciparum. (A) Histogram of distances between adjacent NGGs (left) and TTTVs (right) with unique 20-bp target sites in the 3D7 genome. The horizontal axis represents the distance between two adjacent NGGs or TTTVs, and the vertical axis represents the frequency of NGG or TTTV at this distance throughout the genome. The median and mean distances, as well as the total number of possible target sites for NGG and TTTV, are shown. (B) Distribution analysis of NGG and TTTV in distinct regions of the 3D7 genome. The frequency (left) and enrichment (right) of NGG and TTTV in exon, intron, and intergenic regions are shown. The level of enrichment is shown as the ratio of the frequency to the size of the region. (C) Top left: Target sequence for generation of (Sir2B-mutAsCpf1 highlighting the 23-nt guide sequence and the PAM (top). Modified locus shows the shield mutations (red) (bottom). Bottom left: DNA sequencing analysis of Sir2B-mutAsCpf1. Desired shield mutations are highlighted. Right: Detection of AsCpf1 protein in Sir2B-mutAsCpf1 by western blotting. We used a mouse anti-flag antibody to check the ∼150 kDa AsCpf1 protein and the result shows its expression (red arrow). (D) Top left: Target sequence for generation of ARP6-HAAsCpf1 highlighting the 23-nt guide sequence and the PAM (top). Modified locus shows the shield mutations (red) (bottom). Top right: PCR analysis of ARP6-HAAsCpf1 and WT. Primers are indicated in Figure 3B (primers P8, P9, and P10). The result confirms the presence of HA tag in ARP6 (primers P8/P9, 446 bp in mutant; primers P8/P10, 740 bp in WT, and 800 bp in the mutant). Bottom left: DNA sequencing analysis of ARP6-HAAsCpf1. Desired shield mutations are highlighted. Bottom right: Western blotting of ARP6-HAAsCpf1 and WT. We used a mouse anti-HA antibody to check the ∼116 kDa ARP6-HA protein and the result shows its expression.)

