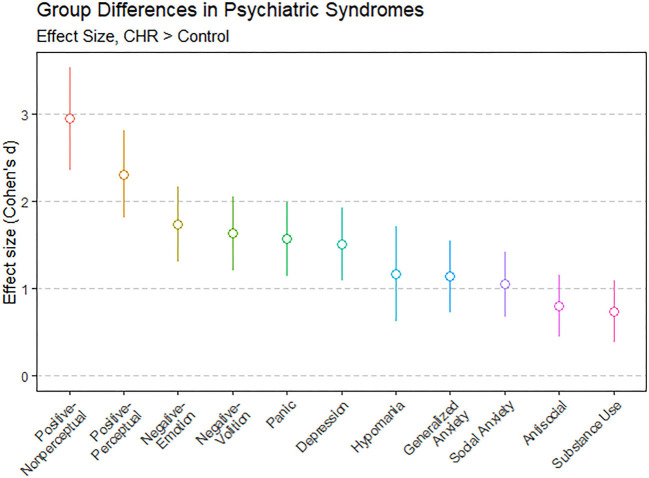
Figure 1.
Group differences between individuals at clinical high risk for psychosis (CHR; n = 71) and matched control participants (n = 73) showed that CHR participants scored significantly higher on all psychiatric syndromes. Group differences for each syndrome are shown as effect sizes in Cohen's d: d = 0 would indicate that CHR and control means were the same, d = 1 would indicate that the CHR mean was 1 standard deviation above the control mean, and so on. Error bars show 95% confidence intervals. Two-tailed t-tests confirmed that all effects were significant, FDR-corrected p < 0.001.

