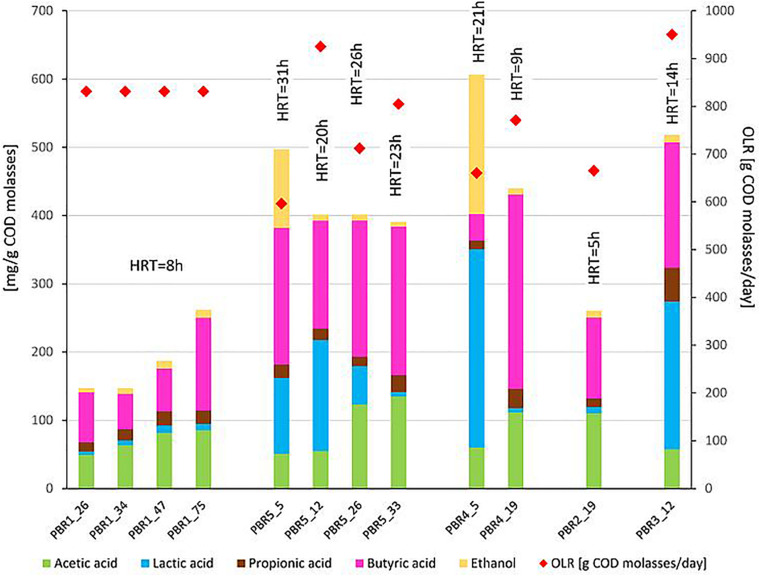
FIGURE 2.
Non-gaseous fermentation products expressed in mg per g of COD of molasses (bars, left axis) and substrate concentration in g of COD of molasses per day (diamonds, right axis) supplied to the bioreactors in selected time points of operation. The composition of fermentation products was analyzed using high-performance liquid chromatography. The data comes from two parallel measurements. HRT is shown over each bar.

