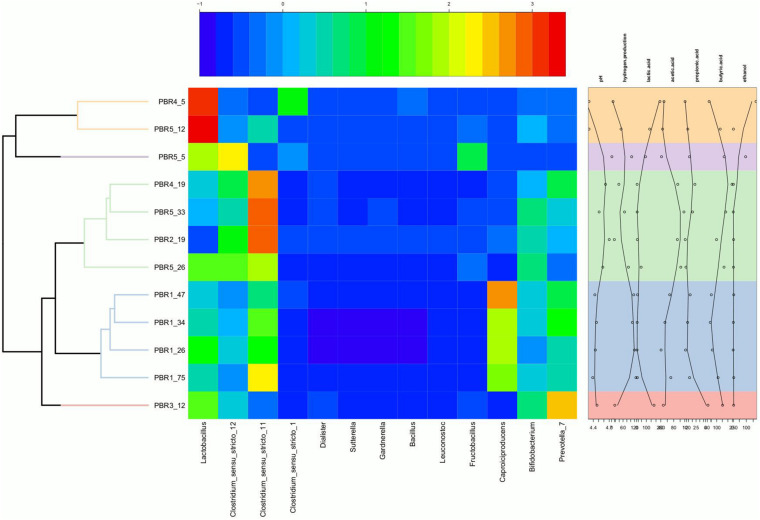
FIGURE 4.
Heatmap showing the relative abundance of genera in the individual PBRs in selected time points with annotation of measured metabolites and pH. The heatmap was generated in R (Heatplus package, annHeatmap2 function) using the relative abundance of the observed genera. For clarity, all genera with summarized relative abundance lower than 0.1% were removed. Rows were clustered using average-linkage hierarchical clustering based on the Bray–Curtis dissimilarity matrix of the dataset (‘vegdist’ from the vegan package).

