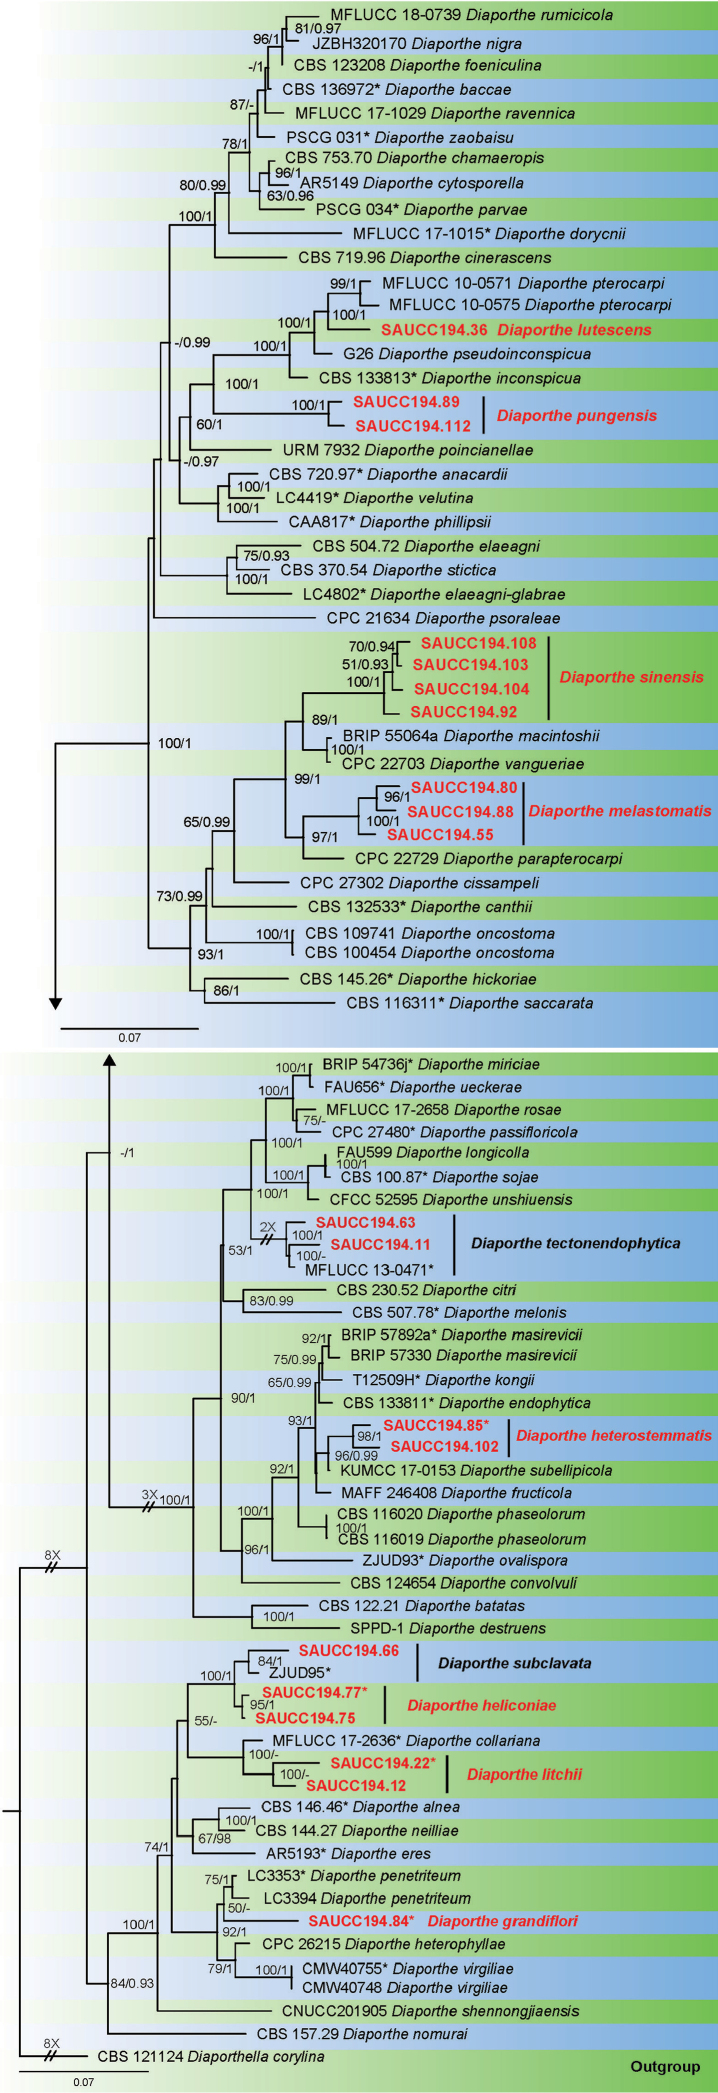
Figure 1.
Phylogram of Diaporthe based on combined ITS, TUB, TEF, CAL and HIS genes. The ML and BI bootstrap support values above 50% and 0.90 BYPP are shown at the first and second position, respectively. Strains marked with “*” are ex-type or ex-epitype. Strains from this study are shown in red. Three branches were shortened to fit the page size – these are indicated by symbol (//) with indication number showing how many times they are shortened.

