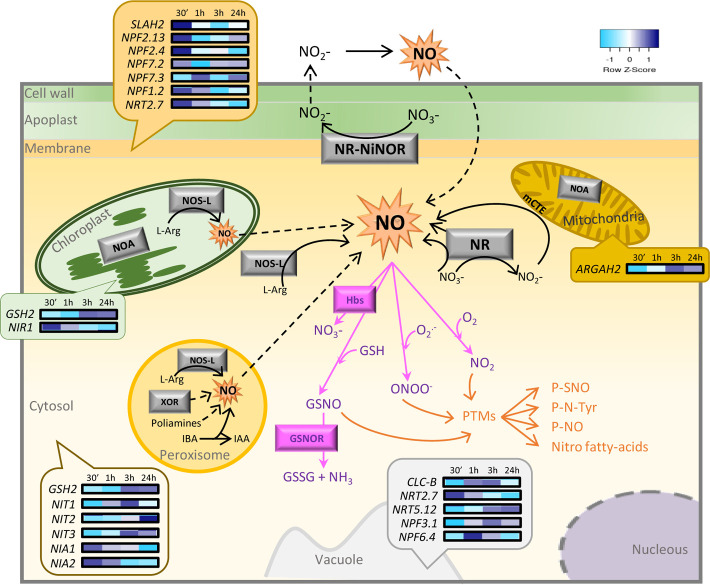
FIGURE 1.
Schematic overview of NO sources and pathways in a plant cell and a heatmap of NO-associated genes expressed in the subcellular locations of A. thaliana after spider mite feeding. The diagram shows the main sources and pathways of NO (black arrows) including both oxidative and reductive pathways, the main scavengers (pink arrows) including superoxide ion, GSH, and hemoglobins, and the main NO mechanisms of action (orange arrows). Discontinued lines represent the mechanisms not experimentally demonstrated. A heatmap showing transcriptomic data of NO-associated genes from A. thaliana at different infestation times (30 min, 1, 3, and 24 h) with T. urticae is comprised within bubbles, positioned over the subcellular compartment where genes are expressed according to SUBA predictions, with a score ≥0.5. IAA, indole-3-acetic acid; IBA, indole-3-butyric acid; GSH, glutathione; GSNO, S-nitrosoglutathione; GSNOR, S-nitrosoglutathione reductase; Hbs, hemoglobins; L-Arg, L-arginine; mETC, mitochondrial electron transport chain; NR, nitrate reductase; NO, nitric oxide; NOS-L, nitric oxide synthase-like; NOA, NO-associated protein; P-NO, nitrosylated protein; P-N-Tyr, nitrated protein; P-SNO, S-nitrosylated protein; PTMs, post-translational modifications; XOR, xanthine oxidoreductase.

