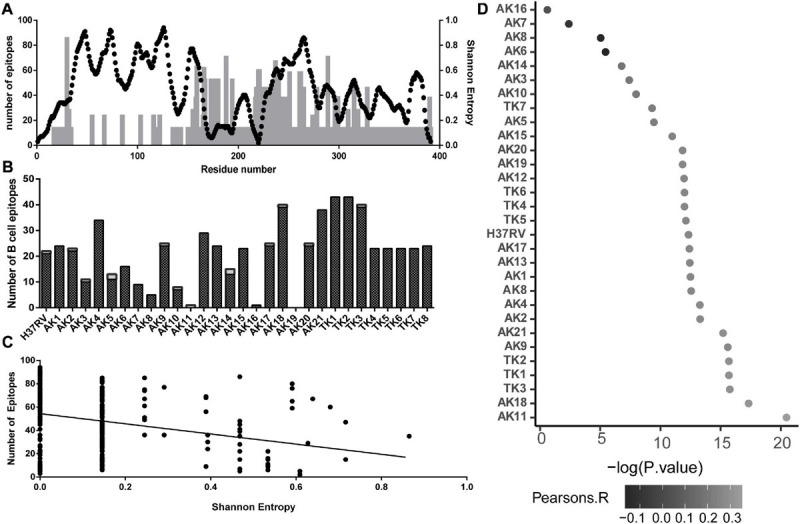
FIGURE 3.

Association between sequence variability of PPE18 and the frequency of T- and B-cell epitopes for a select set of MHC II alleles that occur at high frequency in TB endemic countries, based on the analysis of all protein variants. (A) Illustration of T-cell epitope density and Shannon’s entropy score on a residue in the protein sequence. Black dots, number of epitopes; gray bars, Shannon’s entropy. (B) Number of B-cell epitopes per residue predicted by DiscoTope 2.0 on each variant for each domain. Black bars, domain one; white bar, domain 2. (C) Scatterplot demonstrating the relationship between number of T cell on a given residue and Shannon’s entropy of that residue. The line indicates the line of best fit, with a Pearson’s correlation -0.02294 and P < 0.0001. (D) Manhattan plot showing Pearson’s correlation between B-cell epitope score and Shannon’s entropy at each residue for all of the 30 predicted PPE18 structures. Pearson’s correlation is indicated by the grayscale value of the point, and X-axis represents the -log10 P-value.
