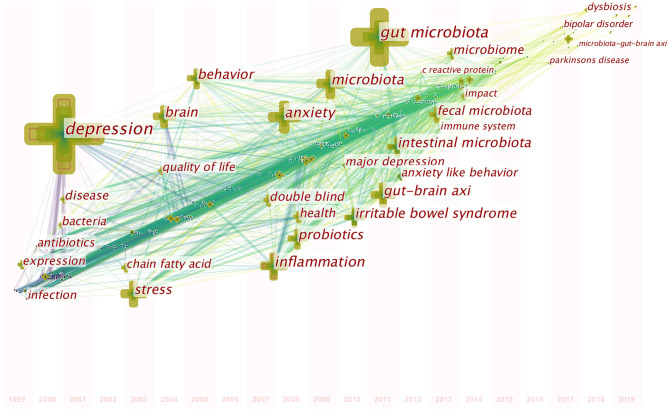
Figure 6.
Time-zone view of keyword co-occurrence in publications from 1999 to 2019 on gut microbiota research in the depression field. The nodes represent keywords, and the chronological order in which keywords appear can be found on the map. The size of a node is proportional to the frequency of keyword occurrence.

