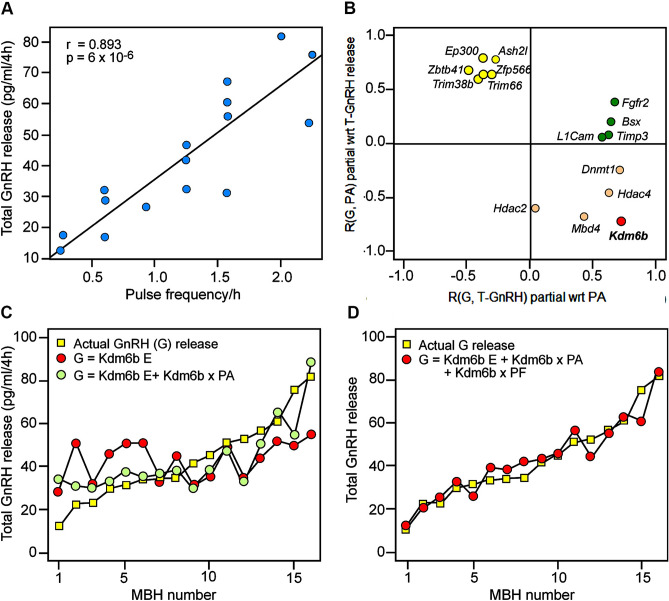
Figure 2.
Correlations between gene expression and GnRH release from the MBH after EED overexpression. (A) Scatterplot of total GnRH release vs. average GnRH pulse frequency/hour over a 4 h incubation period of MBH fragments derived from late juvenile 28-day-old female rats injected 6 days earlier with a lentiviral expressing GFP alone (n = 8) or EED plus GFP (n = 8). Best-fit linear correlation is indicated by black line. (B) Plot of partial correlations (R) of gene expression (G) as assayed by OpenArray/qPCR with total (T) GnRH release and pulse amplitude (PA) with regard to (wrt) other physiological metric. (C) Plot of total GnRH release ordered from lowest to highest (yellow squares) and regression model predictions for ŶTotal Expression = βintercept + βKdm6b expression (red circles) and ŶTotal Expression = βintercept + βKdm6b expression + βKdm6b expression x Pulse Amplitude(PA) (green circles). MBH number refers to one of the 16 MBH incubated in vitro. (D) Plot of total GnRH release ordered from lowest to highest (yellow squares) and regression model prediction for ŶTotal Expression = βintercept + βKdm6b expression + βKdm6b expression × Pulse Amplitude (PA) + βKdm6b expression × Pulse Amplitude (PA) × Pulse Frequency(PF) (red circles).

