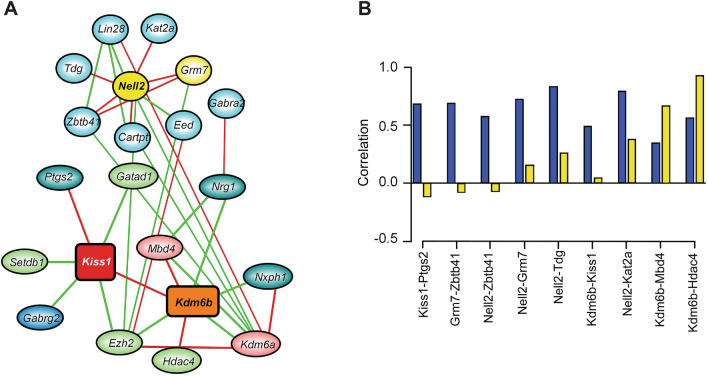
Figure 3.
Gene co-expression networks in the MBH of immature female rats injected with either LV-GFP or LV-EED in the ARC. (A) First and second-neighbor network of strong co-expression edges for Kiss1 and Kdm6b. Positively correlated edges are red, negatively correlated edges are green. First neighbors involved in primarily negative epigenomic regulation are indicated in light green ovals, while positive epigenomic regulators are indicated in red ovals. Non-epigenetic genes are blue ovals. Glutamatergic-related genes are indicated in yellow ovals, other in cyan ovals. (B) Histogram depicting expression correlations of pairs of genes involved in positively correlated strong co-expression relationships with Kdm6b, Kiss1, Nell2 and Grm7 under control conditions (blue bars) and after EED overexpression (yellow bars).

