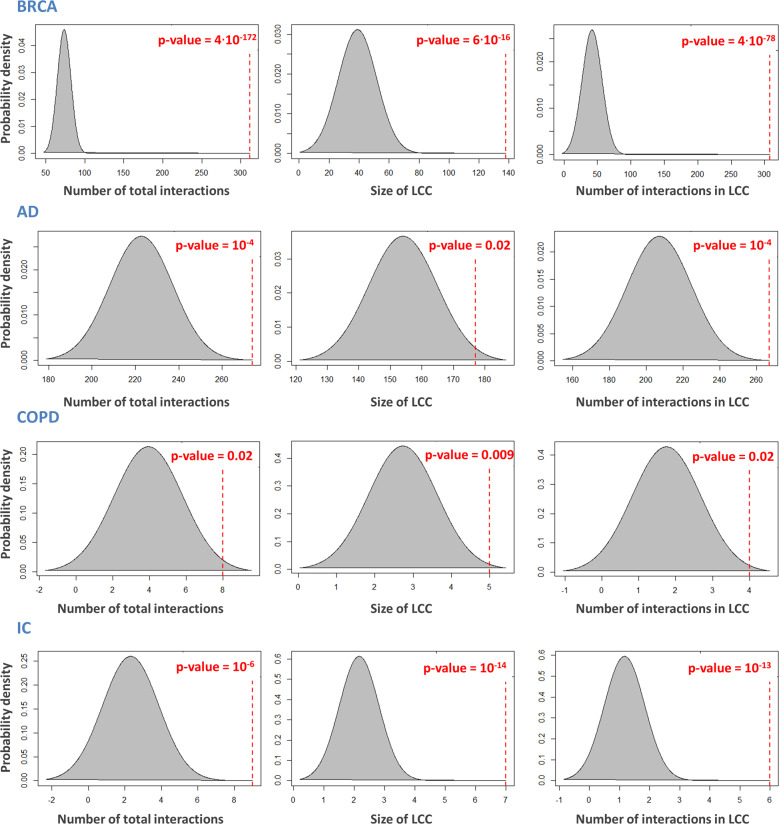
Fig. 2. Examples of SWIM-informed disease module.
From left to right: Distribution of the number of total interactions, the size of the largest connected component (LCC), and the number of edges in the LCC in the subgraph induced by a randomly selected gene set of the same size and degree distribution as the original disease list of the switch genes in the human interactome. Dashed red lines correspond to the observed values of each metric computed for the list of switch genes mapped to the interactome. All p-values were calculated by using a one-tailed z test.

