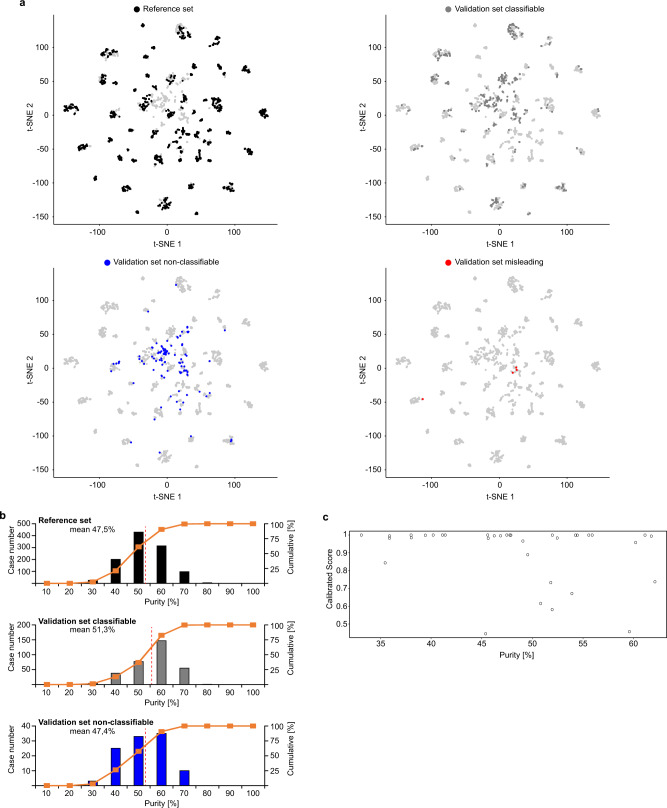
Fig. 5. Impact of tumour cell purity on classifier performance.
a Unsupervised clustering of the combined reference (n = 1077) and diagnostic cohort (n = 428) using t-SNE dimensionality reduction. The reference set is indicated in the upper left plot. The diagnostic samples coded as classifiable (n = 318, grey dots; upper right plot), non-classifiable (n = 106, blue dots; lower left plot) and misleading (n = 4, red dots; lower right plot). The classifiable cases show high overlap with the reference cases. The non-classifiable cases frequently fall in the periphery of or are completely separate from the reference samples. b Tumour cell purity histogram plots of the reference set and the validation set subdivided into classifiable and non-classifiable cases. The mean value is indicated as dashed red line and provided as number [%]. c Tumour cell purity plotted against calibrated score for conventional osteosarcoma cases of the validation set.

