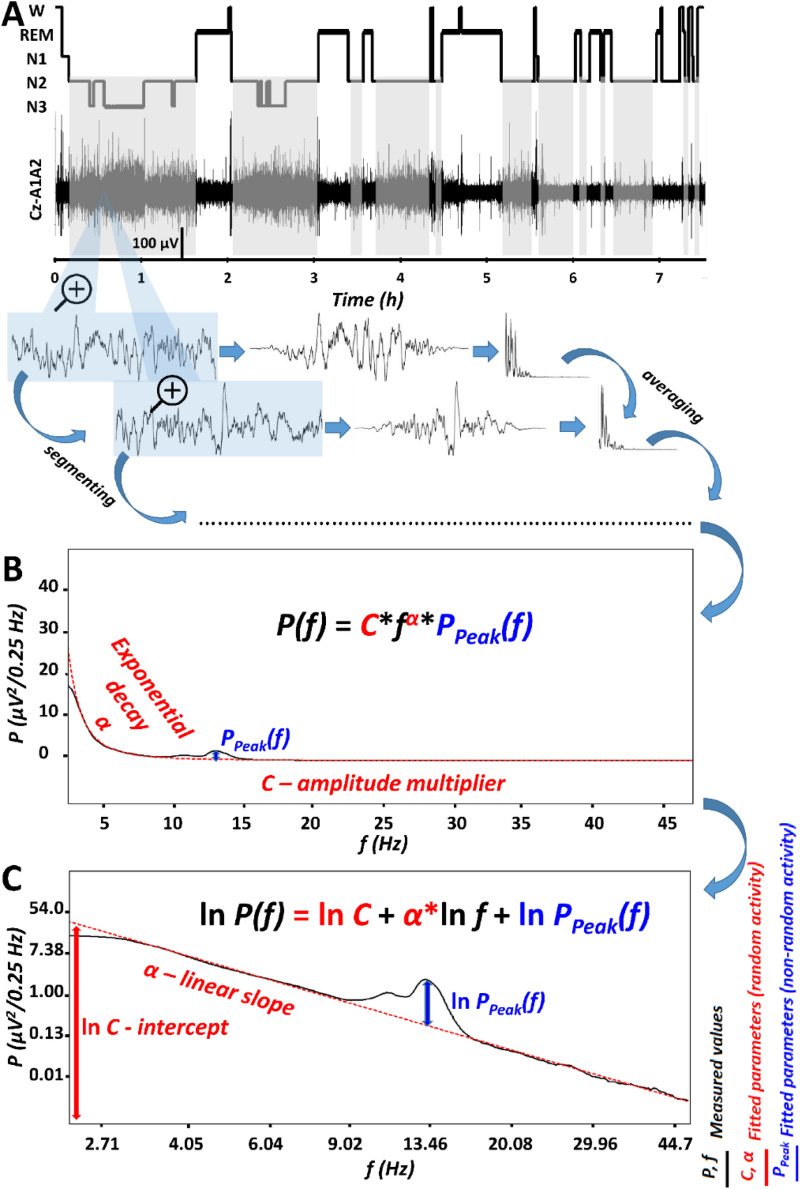
Figure 1.
The parametrization of non-rapid eye movement (NREM) sleep electroencephalogram (EEG) spectra. (A) Hypnogram and steps of the spectral EEG analyses as exemplified in a representative record of a young male volunteer. Grey shaded areas represent NREM sleep, which is analysed in the present report. Blue-shaded EEG segments are magnified 4 s long epochs, with 2 s overlap and modified with a Hanning window before power spectral analysis via mixed-radix Fast Fourier Transformation (FFT). (B) Average spectral power (P) is characterized by a frequency (f)-dependent exponential decay (α), as well as by an overall, frequency-independent amplitude multiplier (C) and a peak power multiplier at critical frequencies [PPeak(f)]. (C) The natural logarithm of spectral power (P) is a linear function of the natural logarithm of frequency (f), characterized by a linear slope α (which is equal with α in panel B) and an intercept (the latter being the natural logarithm of the amplitude multiplier, C in panel B). In addition, this linear function has to be summed with the natural logarithm of the peak power multiplier [PPeak(f), equal to the same frequency-dependent function in panel B]. Please note that “no peak regions” can be compressed in series of all ones, resulting in reduced number of variables as compared to the bins in the original spectra.

