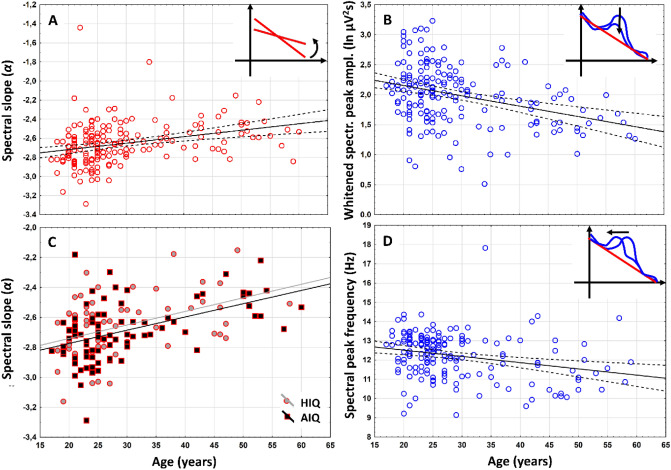
Figure 3.
Representative scatterplots of the correlations between age and measures of the NREM sleep EEG spectra at the left prefrontal region (F3). (A) Correlation of age with the spectral exponent (α) indicating the flattening of the spectral slope in the aged subjects. (B) Correlations of age with the whitened maximal spectral peak amplitude in the sleep spindle frequency range (PPeak(fmaxPeak). Note the decrease in whitened spectral peak amplitude in the aged. (C) Correlation of age with the NREM sleep EEG spectral exponent (α) as categorized by intelligence (HIQ high intelligence quotient, AIQ average intelligence quotient). Note the lack of an IQ effect. (D) Correlation of age with NREM sleep EEG maximal spectral peak frequency (fmaxPeak) in the spindle range. Note the age-dependent decline in frequency. Color codes are consistent with Fig. 1: red—spectral slopes, blue—spectral peaks.

