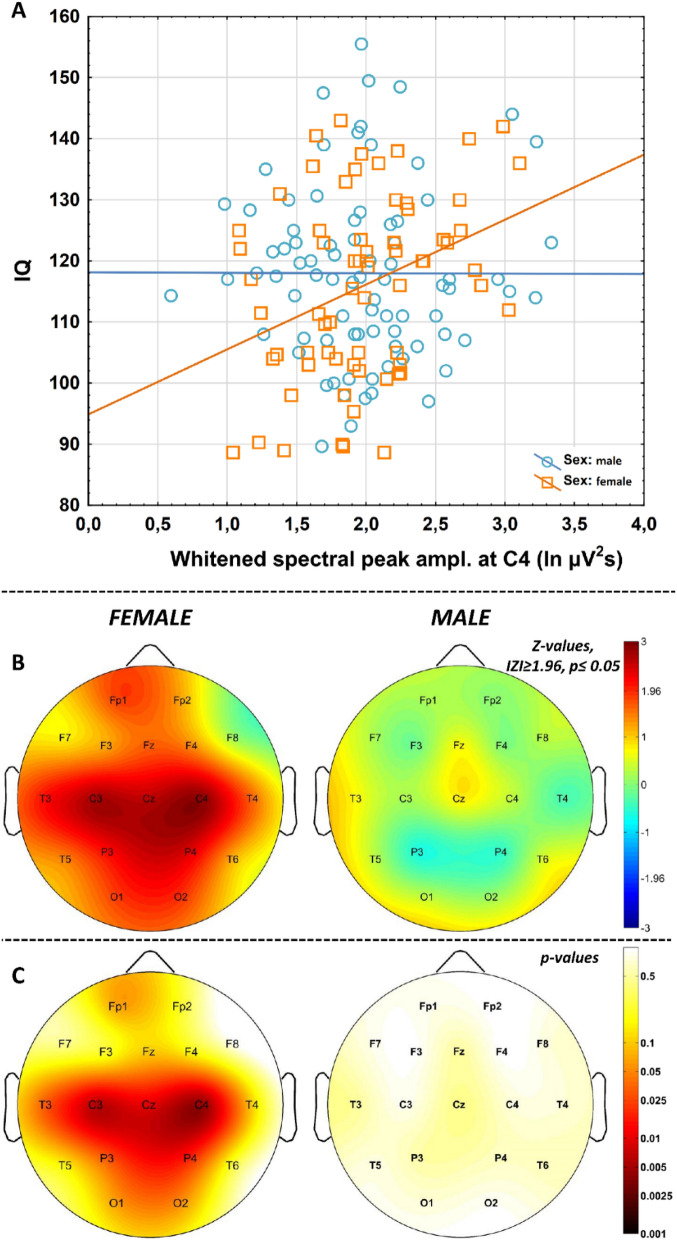
Figure 5.
Correlations between NREM sleep EEG spindle frequency whitened spectral peak amplitudes and IQ in females and males. (A) Categorized scatterplot representing the correlation between whitened spectral peak amplitude of the NREM sleep EEG spindle frequency range (recording site: F4) and IQ in women and men. (B Pearson r-values were transformed to Z-values and represented on topographical maps. C. Significance probability maps of the correlations presented in B.

