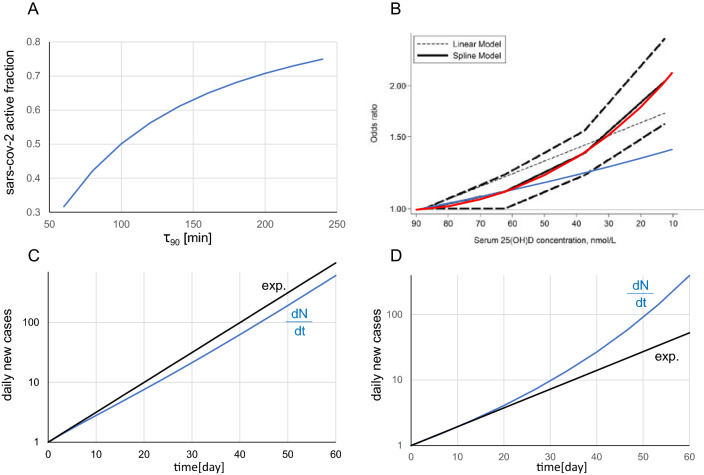
Figure 2.
(A) Survival of the active SARS-CoV-2 fraction after 30 min of solar UV insolation as a function of τ90. (B) Solid black line: acute respiratory track infection (ARTI) risk during cold and influenza epidemics as a function of the 25(OH)D concentration (reprinted from3 according to the CC BY 4.0 licence terms (https://creativecommons.org/licenses/by/4.0/); red and blue curves: power exponential (Eq. 8) and first point monoexponential fits added by the present author. In both graphs, the corresponding date runs from left to right. (C,D) Blue curve: corresponding new daily cases to (A,B) obtained by numerically integrating Eq. (4) (see excel file). In both integrations, k0 was fitted to obtain a typical threefold increase in the last 10 days (see Fig. 1), and ρ was neglected (surge phase). Black curve: mono-exponential curve.

