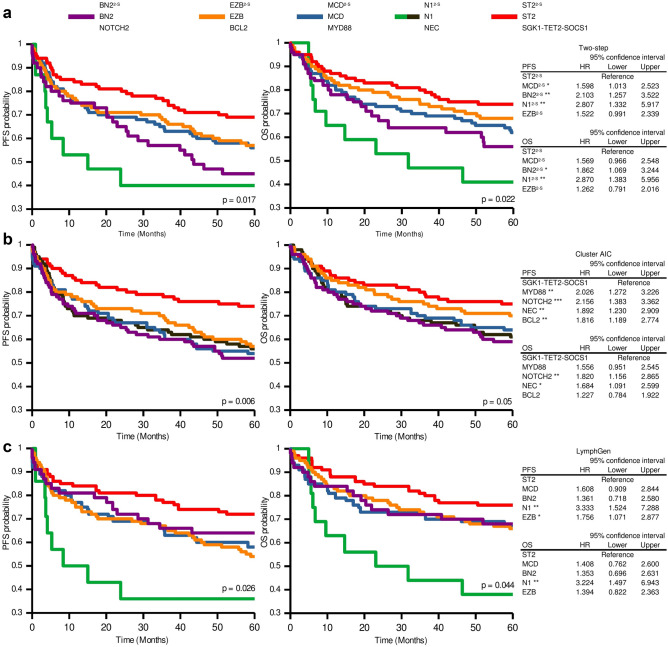
Figure 5.
Progression-free survival (PFS) and overall survival (OS) according to the genetic subtypes of the two-step, AIC cluster and LymphGen classifiers in the HMRN cohort. Kaplan–Meier analysis of genetic subtypes from (A) two-step, (B) AIC cluster and (C) LymphGen methods. Tables on the right of the figure show the hazard ratio (HR) values from the Cox proportional-hazards model of genetic subtypes for PFS and OS status. Error bars represent the 95% confidence intervals. Significance: *p < 0.05; **p < 0.01.

