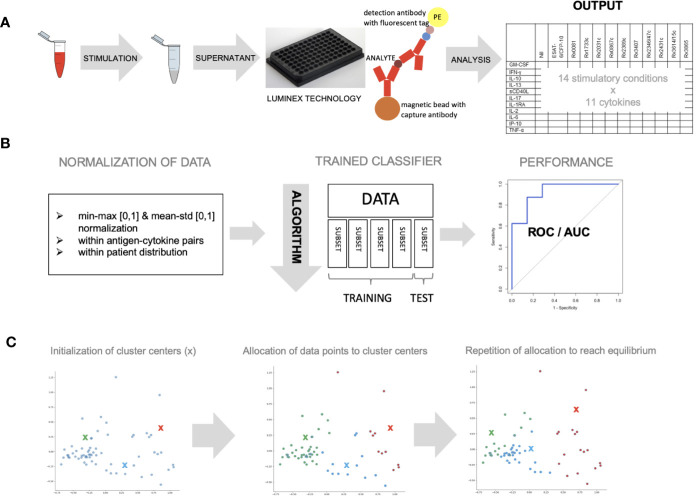
Figure 1.
Whole blood was stimulated with novel antigens and data was analyzed with different machine learning algorithms. (A) Whole blood was stimulated with 11 mycobacterial antigens, left unstimulated and with a positive control, overnight and supernatant was analyzed using Luminex technology to measure 11 different cytokines (B) data was normalized within antigen–cytokine pairs using min-max or mean–std normalization or within patient distribution using the latter only. Data (n = 59) was divided into five equal parts and a classifier discriminating healthy vs. sick children was trained using four subsets and tested on one subset (cross-validation). The algorithm’s parameters were adjusted until performance was optimal. ROC curves were used to measure performance. (C) K-means clustering approach was used to allocate individual data points to three cluster centers randomly. This approach was repeated until optimal data point allocation was reached meaning the sum of the distances from data point to cluster centers is minimized.

