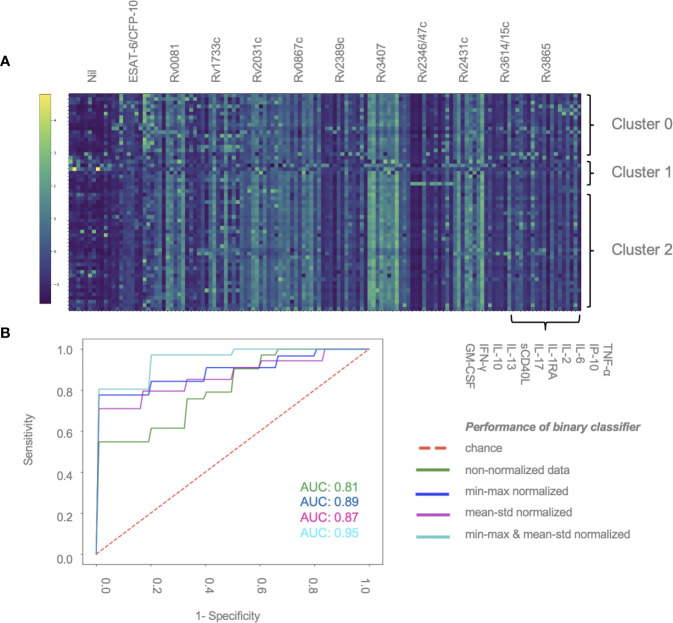
Figure 2.
Normalization of data contributes to performance of discriminative classifier (A) Cytokine concentrations for individual patients. Results are sorted by patient group and clusters (2, 1 or 0), and antigen–cytokine pairs. Clustering was performed using K-means algorithm. Min–max normalization was applied to cytokine–antigen concentrations, mean–std normalization was applied to between-individual measurements (color change from dark blue to light green represents an increase in relative cytokine concentration). (B) AUROC curve showing the performance of the binary classifier (confirmed/unconfirmed TB and TB infection versus TB exposed) in 59 patients using different normalization methods: min–max and mean–std; normalization of antigen–cytokine pairs; min–max/mean-std combining an antigen–cytokine pair normalization with individual patient normalization.

