
Figure 1.
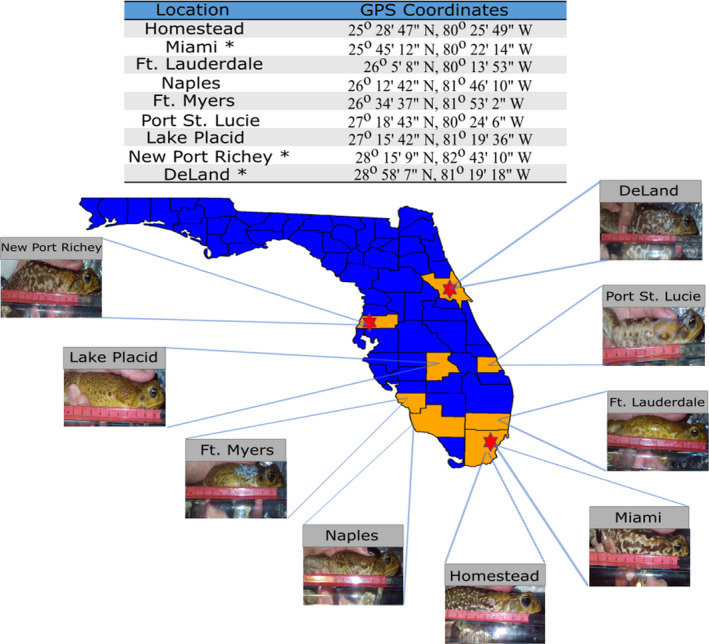
Cane toad populations sampled in 2018 for morphological measures and likelihood of secretion. Locations are listed above images of collected cane toads, with images depicting representative toads from each sampled location being recorded for gland sizes following mass, sex, and SVL being recorded. Toads were collected along a south to north gradient, from Homestead to DeLand, FL. Sites indicated by a star indicate populations sampled in 2019 for MBG concentration in poison secretions