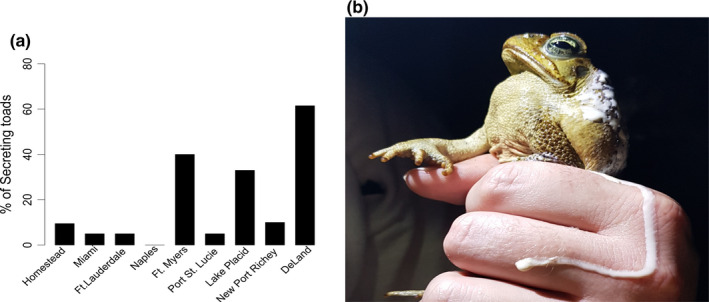
Figure 2.

Poison secretion data collected from 9 cane toad populations spanning a south to north gradient in FL (n = 21, 25, and 13 for Homestead, Ft. Myers, and DeLand, and n = 20 for all other populations). Panel (a) represents percentages of toads secreting poison following 1 hr of capture and handling. The likelihood of a toad secreting poison following collection in the field increased significantly (z173 = 3.24, p < .01) with increasing latitude, from the most southern population (Homestead) to the most northern (DeLand, FL). Panel (b) depicts a toad secreting poison immediately following capture from a northern FL population (DeLand)
