
FIGURE 2.
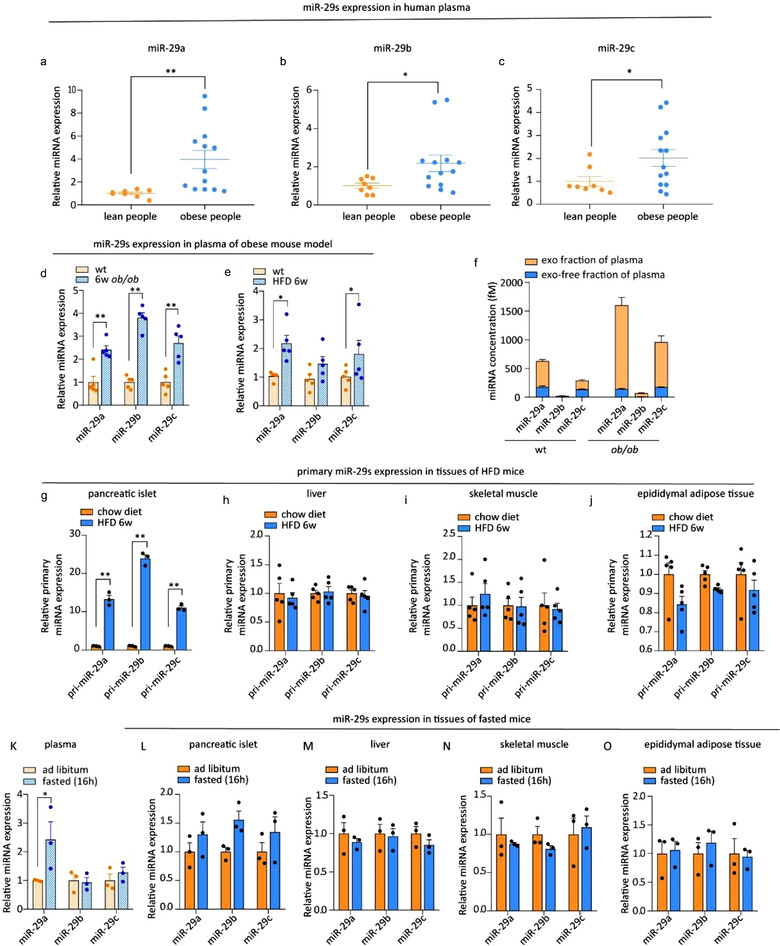
(a‐c) qPCR analysis of the levels of miR‐29a, miR‐29b, and miR‐29c in the plasma of healthy donors (n = 8) and obese people (n = 13). (d) qPCR analysis of the levels of miR‐29s in the plasma of 6‐week‐old, male, wild‐type and ob/ob mice (n = 5 for each group). (e) qPCR analysis of the levels of miR‐29s in the plasma of mice fed a chow diet or HFD (n = 5 for each group). (f) qPCR analysis of the miR‐29s concentrations in the exosome‐free plasma fraction or exosomal fraction isolated from the plasma of 6‐week‐old, male, wild‐type or ob/ob mice. Plasma was obtained from 15 mice in each group and pooled to harvest exosomes. (g‐j) qPCR analysis of the levels of primary miR‐29s in pancreatic islets (g), livers (h), skeletal muscles (i) and gonadal adipose tissues (j). Islets from three mice were pooled together and represent a single spot in panel g (n = 5 for each group in panels h, i and j). (k‐o) qPCR analysis of the levels of miR‐29s in the plasma (k), pancreatic islets (l), livers (m), skeletal muscles (n) and gonadal adipose tissues (o) of mice fed an ad libitum diet or fasted for 16 h (n = 3 for each group). Islets from three mice were pooled together and represent a single spot in panel L (n = 3 for each group in panels l, m, and n)