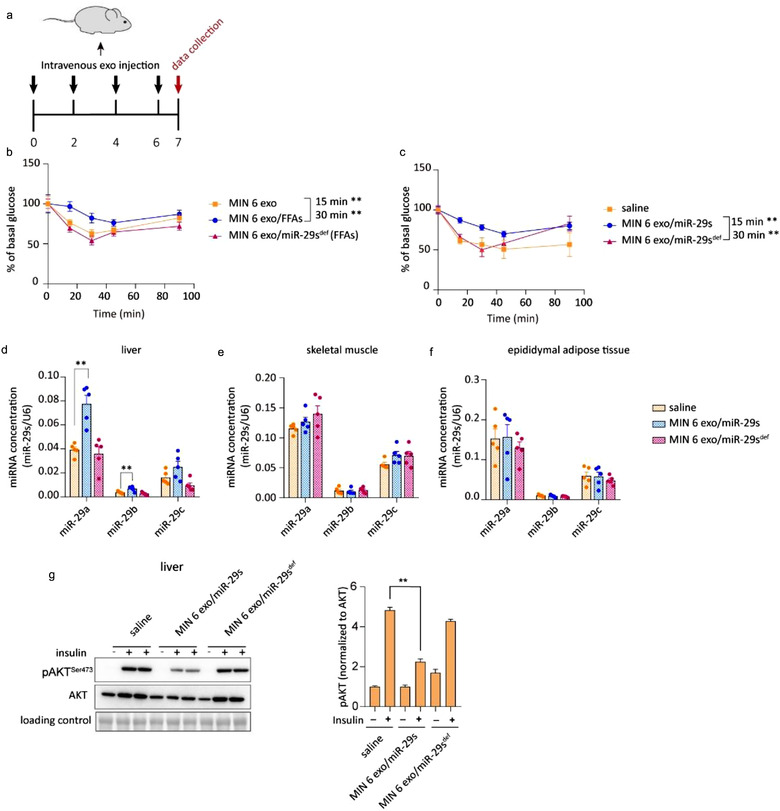
FIGURE 3.

(a) Schematic of the intravenous injection of exosomes. Exosomes were administered once every 2 days for a total of four injections. Fifty micrograms of exosome was injected each time. (b) The insulin tolerance test (ITT) was administered to mice injected with various exosomes as indicated. Wild‐type mice were inoculated intravenously with exosomes isolated from untreated or FFA‐treated MIN 6 cells or MIN 6 cells co‐treated with FFAs and miR‐29s antagomir (n = 8 for each group). (c) The insulin tolerance test (ITT) was administered to mice injected with various exosomes as indicated. Wild‐type mice were inoculated intravenously with saline or exosomes isolated from miR‐29s‐overexpressing MIN 6 cells or miR‐29s‐depleted MIN 6 cells (n = 8 for each group). (d‐f) qPCR analysis of the levels of miR‐29s in livers (d), skeletal muscles (e) and gonadal adipose tissues (f) (n = 5 for each group). (g) Representative western blot of insulin‐stimulated AKT phosphorylation in the livers of mice injected with saline or exosomes replete with or depleted of miR‐29s (left panel). Analysis of western blots from n = 3 independent experiments (right panel)
