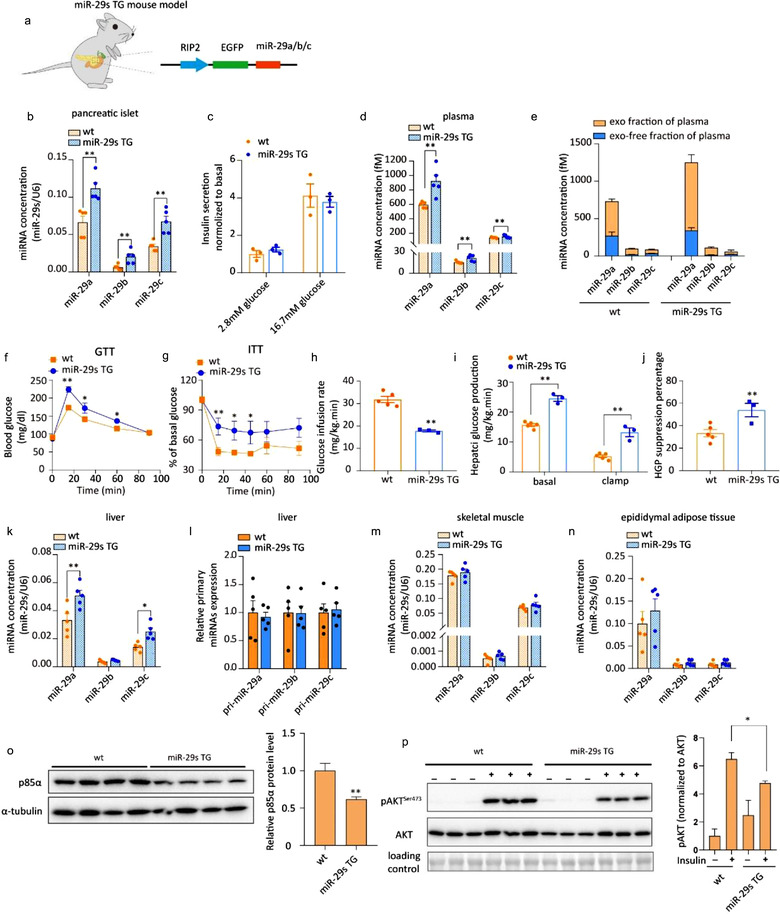
FIGURE 4.

(a) Schematic of the generation of mice whose pancreatic β cells overexpressed miR‐29s. (b) qPCR analysis of miR‐29s concentrations in the pancreatic islets of wild‐type or miR‐29s TG mice. Islets from three mice were pooled together and represent a single spot (n = 15 for each group). (c) Glucose‐stimulated insulin secretion (GSIS) of cultured pancreatic islets. Levels of insulin secretion were normalized to the amount of protein in the islets. (d) qPCR analysis of the miR‐29s concentrations in the plasma of wild‐type and miR‐29s TG mice (n = 5 for each group). (e) qPCR analysis of the miR‐29s concentrations in the exosome‐free plasma fraction or exosomal fraction isolated from the plasma of wild‐type or miR‐29s TG mice. Plasma was obtained from 15 mice in each group and pooled to harvest exosomes. (f) The intraperitoneal glucose tolerance test (i.p. GTT) was administered to wild‐type or miR‐29s TG mice (n = 15 for each group). (g) The insulin tolerance test (ITT) was administered to wild‐type or miR‐29s TG mice (n = 8 for each group). (h‐i) Hyperinsulinaemic‐euglycaemic clamping of wild‐type or miR‐29s TG mice. The glucose infusion rate (h) and hepatic glucose production (i) by insulin are expressed as mg/kg.min. The percentage of HGO suppression (j) was analysed according to the results in panel I. (k) qPCR analysis of the miR‐29s concentrations in the livers of wild‐type or miR‐29s TG mice (n = 5 for each group). (l) qPCR analysis of the expression of primary miR‐29s levels in the livers of wild‐type or miR‐29s TG mice (n = 5 for each group). (m‐n) qPCR analysis of the concentrations of miR‐29s in the skeletal muscle and adipose tissue of wild‐type or miR‐29s TG mice (n = 5 for each group). (o) Representative western blot of p85α and α‐tubulin in the livers of wild‐type or miR‐29s TG mice (left panel). Analysis of p85α western blots from n = 3 independent experiments (right panel). (p) Representative western blot of insulin‐stimulated AKT phosphorylation in the livers of wild‐type or miR‐29s TG mice (left panel). Analysis of western blots from n = 3 independent experiments (right panel)
