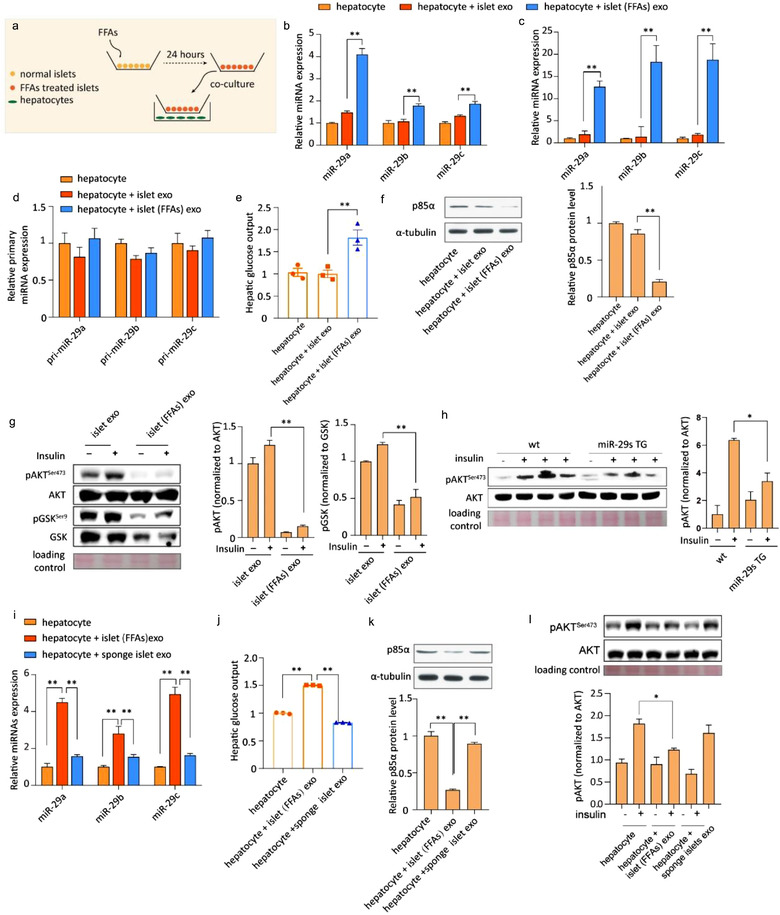
FIGURE 7.

(a) Schematic of the co‐culture system. (b) qPCR analysis of the expression of miR‐29s in untreated hepatocytes or hepatocytes co‐cultured with either normal islets or FFA‐treated islets. Data are from n = 3 independent experiments. (c) qPCR analysis of the expression of miR‐29s in untreated hepatocytes or hepatocytes treated with exosomes from either normal islets or FFA‐treated islets. Data are from n = 3 independent experiments. (d) qPCR analysis of the expression of primary miR‐29s in the groups indicated in panel C. (e) Glucose output assay of hepatocytes treated as indicated in panel C. (f) Representative western blot of p85α and α‐tubulin in hepatocytes treated as indicated in panel C (left panel). Analysis of p85α western blots from n = 3 independent experiments (right panel). (g) Representative western blot of the insulin signalling pathway in hepatocytes treated as indicated in panel C (left panel). Analysis of western blots from n = 3 independent experiments (right panel). (h) Representative western blot of insulin‐stimulated AKT phosphorylation in hepatocytes isolated from wild‐type or miR‐29s TG mice (left panel). Analysis of western blots from n = 3 independent experiments (right panel). (i) qPCR analysis of the expression of miR‐29s in untreated hepatocytes or hepatocytes treated with exosomes from either FFA‐treated islets or sponge islets. Data are from n = 3 independent experiments. (j) Glucose output assay of hepatocytes treated as indicated in panel I. (k) Representative western blot of p85α and α‐tubulin in hepatocytes treated as indicated in panel I (upper panel). Analysis of p85α western blots from n = 3 independent experiments (bottom panel). (l) Representative western blot of insulin‐stimulated AKT phosphorylation in hepatocytes treated as indicated in panel I (upper panel). Analysis of p85α western blots from n = 3 independent experiments (bottom panel)
