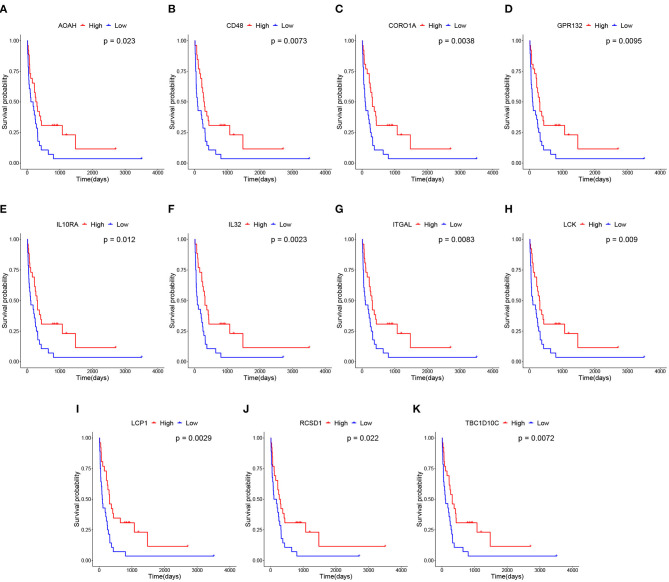
Figure 6.
Survival analysis of 11 hub genes in metastatic melanoma in GEO GSE22154 dataset. Note that the red curves represent the samples with a highly expressed gene and the blue curves represent samples with a lowly expressed gene. (A) Overall survival (OS) of AOAH. (B) OS of CD48. (C) OS of CORO1A. (D) OS of GPR132. (E) OS of IL10RA. (F) OS of IL32. (G) OS of ITGAL. (H) OS of LCK. (I) OS of LCP1. (J) OS of RCSD1. (K) OS of TBC1D10C.

