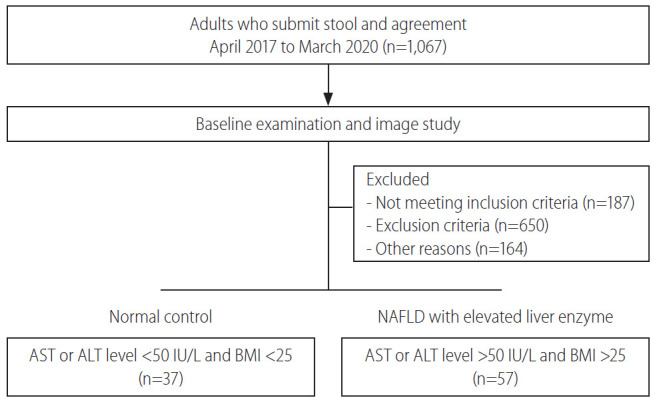
Figure 1.

Patient enrollment diagram. Ninety-four patients participated in this experiment. According to their conditions, patients were divided into either normal control or NAFLD with elevated liver enzyme groups. NAFLD, nonalcoholic fatty liver disease; AST, aspartate aminotransferase; ALT, alanine aminotransferase; BMI, body mass index.
