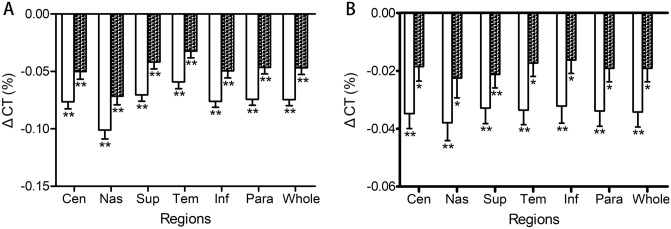
Figure 2.
Changes in CT% at different locations immediately after exercise and after rest. (A) Changes of CT% at different locations of myopic eyes. (B) Changes of CT% at different locations of emmetropic eyes. The error bars represent the standard error of the mean (*, p < 0.05; **, p < 0.001 vs. pre-exercise, respectively). CT choroidal thickness; Cen central region; Nas nasal; Sup superior; Tem temporal; Inf inferior represents the mean data of inner and outer regions. Para, parafoveal region; Whole, whole region.

