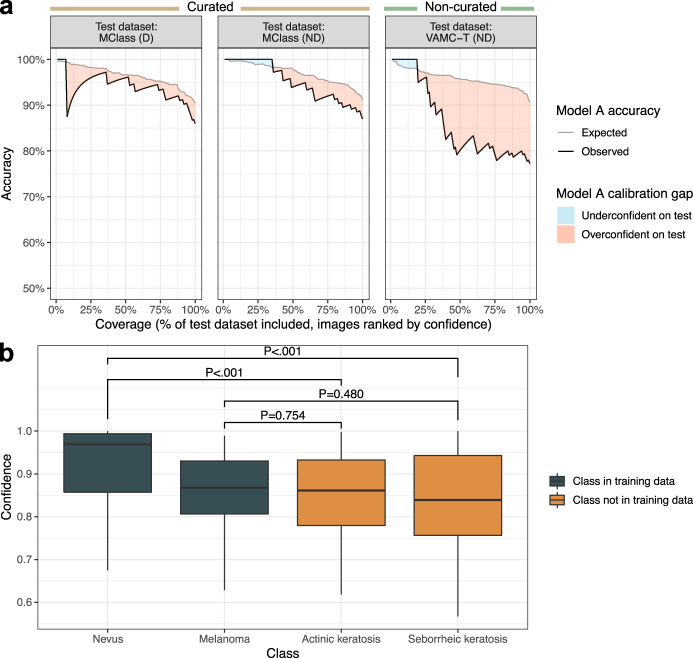
Fig. 2. Calibration on development dataset does not generalize to benchmark test datasets.
a Response rate accuracy curves showing expected accuracy (i.e., accuracy on validation dataset, gray line) and observed accuracy (black line) are plotted against coverage, or the percentage of the test dataset evaluated, with test images ranked by descending Model A prediction confidence. Different values of coverage were obtained by varying the confidence threshold across the range of confidences for test dataset predictions, such that only predictions with confidence greater than the threshold were considered. Accuracy was calculated using a melanoma probability threshold of 0.5, i.e., the predicted class was the class with higher absolute probability. A sharp dip in accuracy from 100% to 87.5% was observed at 8% coverage for MClass-D (n = 100) because the prediction ranked 8th out of 100 by confidence was incorrect, resulting in accuracy 7/8 = 87.5%. b Model A prediction confidence across test images from disease classes encountered during model training (melanoma, nevus) vs those not encountered during training (actinic keratosis, seborrheic keratosis; confidences plotted on out-of-distribution images are for a prediction of melanoma). All images are from the ISIC archive. P-values from the Wilcoxon rank sum test are shown in text. There is no statistically significant difference in confidence on images with a true diagnosis of melanoma vs actinic keratosis (P = 0.754) or seborrheic keratosis (P = 0.480). Each boxplot displays the median (middle line), the first and third quartiles (lower and upper hinges) and the most extreme values no further than 1.5 * the interquartile range from the hinge (upper and lower whiskers). Abbreviations: D dermoscopic, ISIC International Skin Imaging Collaboration, MClass Melanoma Classification Benchmark, ND non-dermoscopic, VAMC-T Veterans Affairs Medical Center teledermatology.

