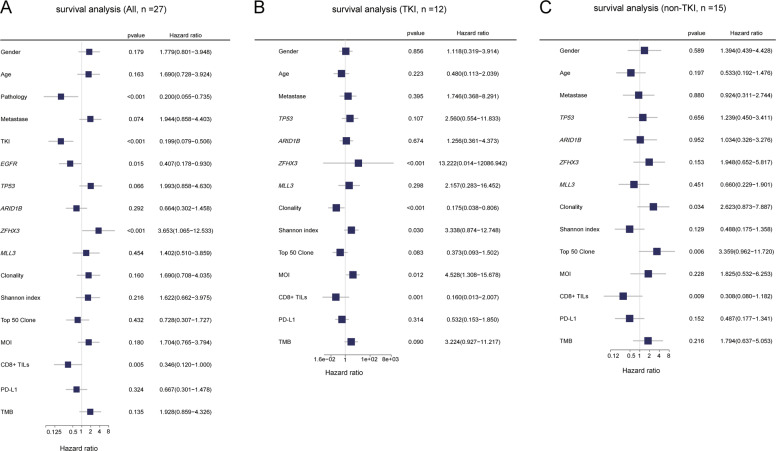
Fig. 5. The analysis of molecular factor for prognosis.
A, B and C show the result of survival analysis with all patients, patients receiving EGFR targeted therapy (TKI group), and no EGFR targeted therapy (non-TKI group). All molecular features fall into two categories, dichotomous and continuous: gender(male/female), pathology (LUAD/other), metastatic type (synchronous/metachronous), EGFR TKI therapy (with TKI/non-TKI), EGFR (positive/negative), TP53 (positive/negative), ARID1B (positive/negative), ZFHX3 (positive/negative), MLL3 (positive/negative) and PD-L1 (positive/negative) were performed Kaplan-Meier survival analysis. For continuous factors, maximally selected rank statistics was performed to calculate optimal cutoffs. Those factors were divided into higher and lower groups according to cutoffs. Hazard ratio (HR) was calculated by high group compare to low group.

