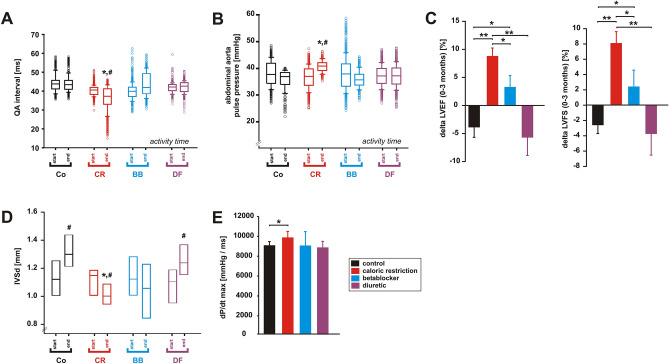
Figure 2.
Effects of 3 months CR, beta-blocker or diuretic on LV systolic function. (A) Changes in QA interval and (B) in pulse pressure during the study (n = 5 per group). *p < 0.05 vs. control, #p < 0.05 vs. respective value at the beginning of the study. (C) Changes in LV ejection fraction (ΔEF%) and in LV fractional shortening (ΔFS%) during the study (n = 10 per group). *p < 0.05; **p < 0.01. (D) Changes in interventricular septum diameter in diastole (IVSd) during the study. *p < 0.05 vs. control, #p < 0.05 vs. respective value at the beginning of the study. (E) Maximal rate of rise of LV pressure (dP/dt max) at the end of the study (n = 5 per group). *p < 0.05. All data are mean ± SEM. Co = control, CR = caloric restriction, BB = beta-blocker, DF = diuretic. Data were obtained by telemetry (A, B), echocardiography (C, D) or catheter measurements (E).

