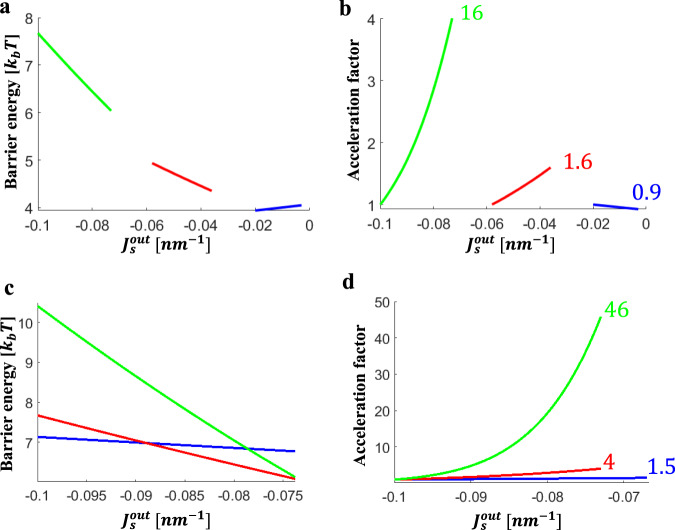
Fig. 3. Dependence of the energy barrier and the acceleration factor of the fusion pore formation on the spontaneous curvature of the proximal monolayers and on the tilt decay length.
a, b describe the effects of varying background spontaneous curvature, on the energy barrier (a) and the acceleration factor (b): Blue line , red line , and green line . c, d describe the effect of tilt decay length, on the energy barrier (c) and the acceleration factor (d): Blue line , red line , and green line . The parameter values used in all panels: , , T, , and . The tilt decay length size used in a and in b is and the background spontaneous curvature in panels c and d is . In panels b and d the acceleration factor is indicated for the maximal calculated area fraction of LPC in the proximal monolayers. b: Blue line, , maximal fraction of LPC is 6%, . Red line, maximal fraction of LPC is 6.8%, . Green line, maximal fraction of LPC is 7.5% LPC, . d: Blue line, maximal fraction of LPC is 10%, β = 1.5 Red line, maximal fraction of LPC is 7.5%, β = 4. Green line, l = 2 nm, maximal fraction of LPC is 7.5%, β = 46.

