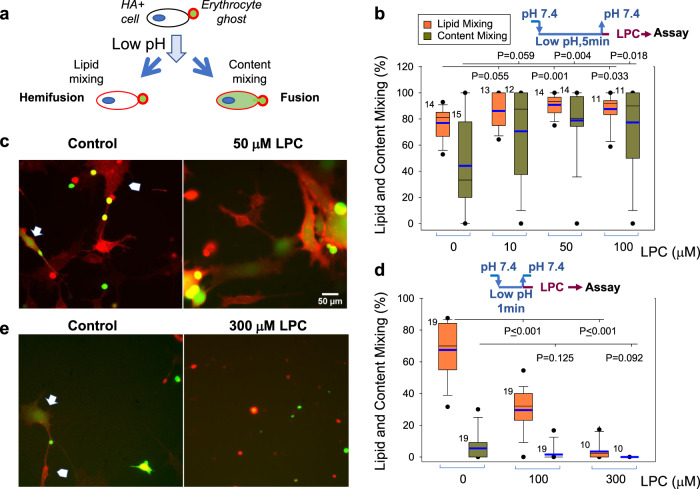
Fig. 4. Dependent on the time of application and concentration, LPC either promotes hemifusion-to-fusion transition or inhibits hemifusion stage in HA-mediated cell fusion.
a Cartoon depicting influenza hemagglutinin (HA)-mediated fusion assay. HA-expressing 3T3 fibroblasts with pre-bound erythrocytes that were labeled with both lipid and content probes were treated with a low pH pulse. Lipid mixing without content mixing and lipid- and content- mixing report hemifusion and fusion, respectively. b, c HA-cells with pre-bound erythrocytes were treated with a 5-min pulse of pH 5.0 medium at 22 °C. Immediately after the end of low pH pulse, we applied the PBS supplemented with different concentrations of LPC. d, e HA-cells with pre-bound erythrocytes were treated with a 1-min pulse of pH 5.0 medium at 22 °C. Immediately after the end of low pH pulse, we applied the PBS supplemented with different concentrations of lysophosphatidylcholine (LPC) at the room temperature. b, d Fusion was analyzed with fluorescence microscopy 60 min after the low pH application. Content mixing (fusion) and lipid mixing (fusion plus hemifusion) were quantified as the ratios of the numbers of either content probe (carboxyfluorescein)-labeled HA-cells or lipid probe (PKH26)-labeled HA-cells, respectively, to the total number of HA-cells. Both b and d present representative results in one of three independent cell preparations each. N, the number of randomly selected fields of view examined for each condition is indicated to the left of the box associated with that data. Box-and-whisker plots show median (center line), mean (blue line), 25–75th percentiles (box), 10–90th percentiles (whiskers), and 5–95th percentiles (solid circles). P-values were calculated using a two-tailed unpaired t-test. c, e Representative images for the experiments in B taken for control cells and for the cells treated with 50 μM LPC (c) and for the experiments in d taken for the control cells and for the cells treated with 300 μM LPC (e). Arrows mark examples of fusion: HA-cells that acquired from fused RBC both lipid (red)- and content (green) probes. Arrowheads mark examples of hemifusion: HA-cells that acquired from fused RBC only lipid (red) probes. Scale bar 50 μm.

