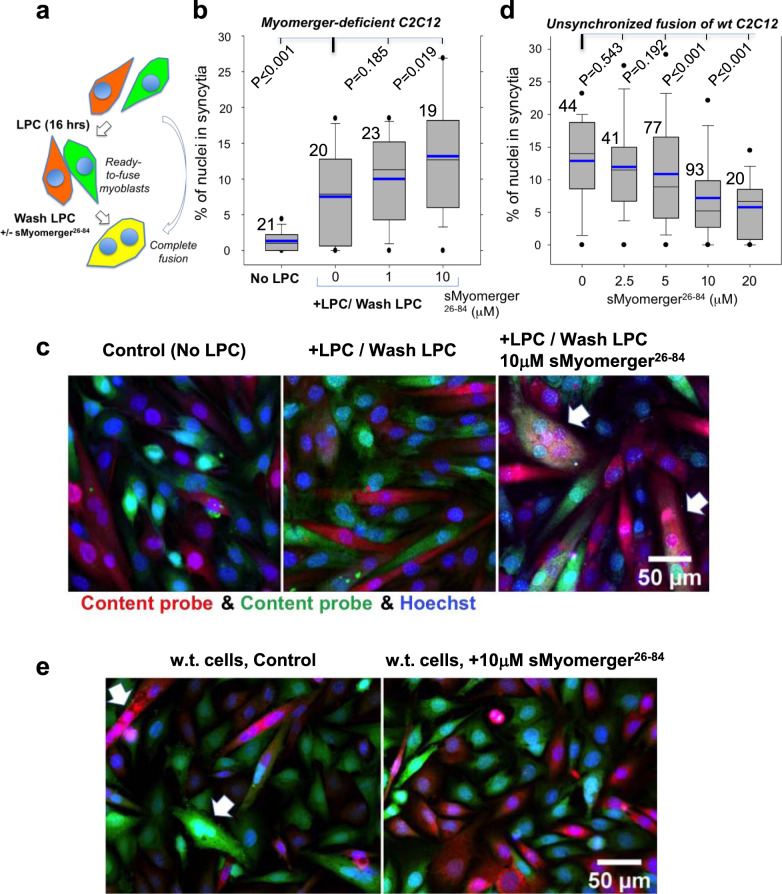
Fig. 8. Effects of LPC and sMyomerger26-84 on synchronized fusion of Myomerger-deficient C2C12 cells and sMyomerger26-84 on unsynchronized fusion of wild type (w.t.) C2C12 cells.
a Within 3 days period of differentiation, Myomerger-deficient C2C12 cells were labeled with either orange cell tracker or green cell tracker, and then treated with the hemifusion inhibitor lysophosphatidylcholine (LPC) in the differentiation medium (DM) for 16 h to accumulate myoblasts that are ready to fuse. LPC removal (‘LPC wash’) allowed the cells to undergo hemifusion and complete fusion. sMyomerger26-84 in different concentrations was applied for 1 h at the time of LPC removal. In another experimental design, Myomerger-deficient C2C12 cells differentiated for 3 days (b, c) or w.t C2C12 cells differentiated for 2 days (d, e) were allowed to fuse without LPC block. b Quantification of synchronized fusion in the presence of different LPC concentrations and fusion extents observed at the same time post-differentiation for unsynchronized fusion (No LPC) for Myomerger-deficient C2C12 cells. c Representative images for the experiments in b taken for the No LPC, 0 and 10 μM sMyomerger26-84 experiments. Arrows mark examples of fusion. Scale bar 50 μm. d W.t. C2C12 cells differentiated for 2 days, labeled with either orange cell tracker or green cell tracker and co-plated in the DM in the presence of different concentrations of sMyomerger26-84. Fusion was scored 4 h after co-plating. e Representative images for the experiments in D taken for the 0 and 10 μM sMyomerger26-84 experiments. Arrows mark examples of fusion. Scale bar 50 μm. b, d Fusion was quantified by assessing formation of multinucleated cells as the ratio of nuclei in the cells with ≥2 nuclei to the total number of nuclei. N, the number of randomly selected fields of view examined over three independent cell preparations for each condition, is indicated to the left of the box associated with that data. Box-and-whisker plots show median (center line), mean (blue line), 25–75th percentiles (box), 10–90th percentiles (whiskers), and 5–95th percentiles (solid circles). P-values were calculated using a two-tailed unpaired t-test.

