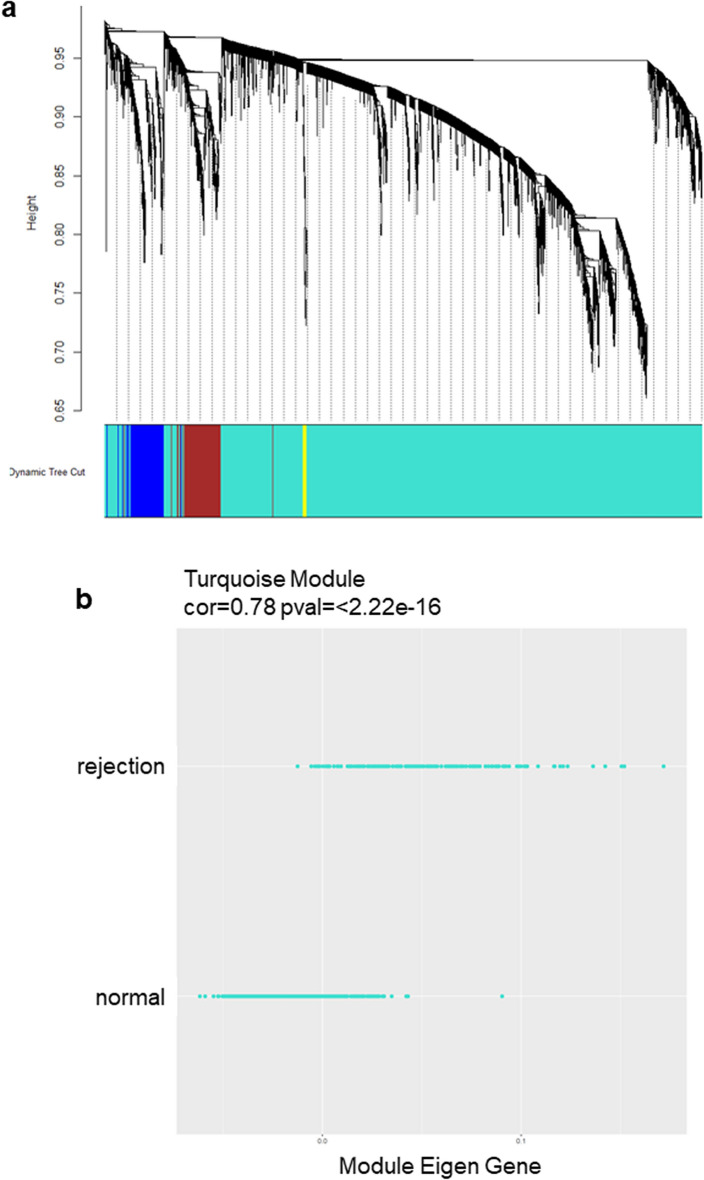
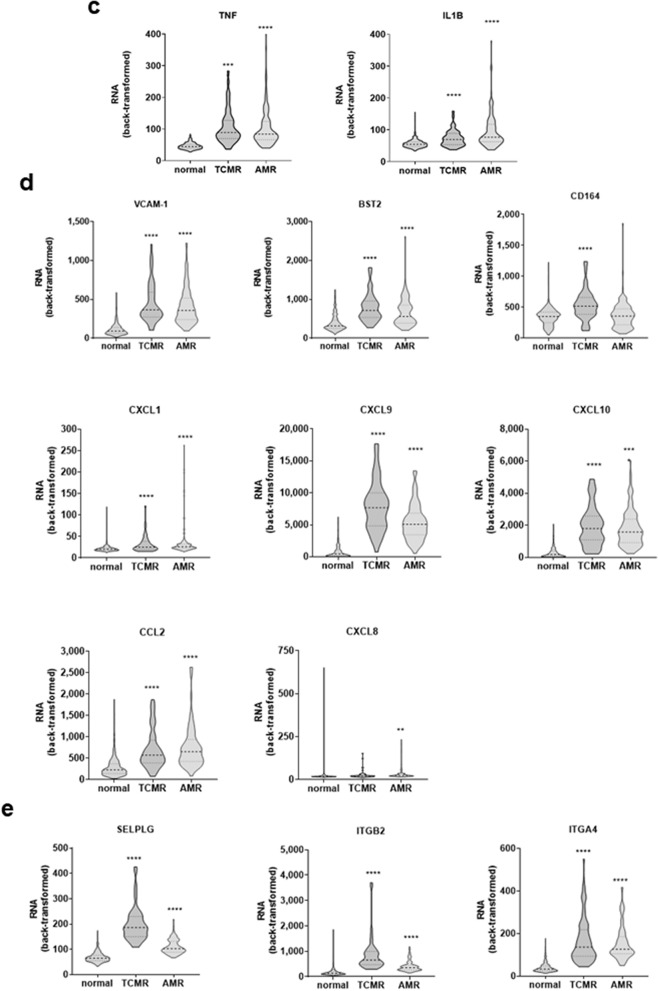
Figure 1.
Weighted Correlation Network Analysis of transcript changes within cardiac allograft biopsies with rejection versus stable [GSE124897]. (a) Gene dendrogram and module colors for the top 5,000 genes with the most significant Wilcoxon test p value, comparing rejection to non-rejection/normal. The top 4 modules (turquoise, yellow, blue and brown) are shown. The branches indicate modules of interconnected gene groups. (b) Distribution of expression of genes within the Turquoise Module in biopsies with rejection versus non-rejection/normal. (c–e) Violin plots show the expression of inflammatory effector molecules and of leukocyte receptors for endothelial adhesion molecules in normal cardiac transplant biopsies and those with TCMR or ABMR. The backtransformed values for intragraft (c) proinflammatory cytokines TNF and IL1B. (d) endothelial adhesion and recruitment genes VCAM1, BST2, CD164/endolyn, CXCL1/GROα, CXCL9/MIG, CXCL10/IP-10, CCL2/MCP-1, CXCL8/IL-8; and (e) cognate leukocyte receptors SELPG/PSGL-1, ITGB2/LFA-1/Mac-1, and ITGA4/VLA-4 are shown.


