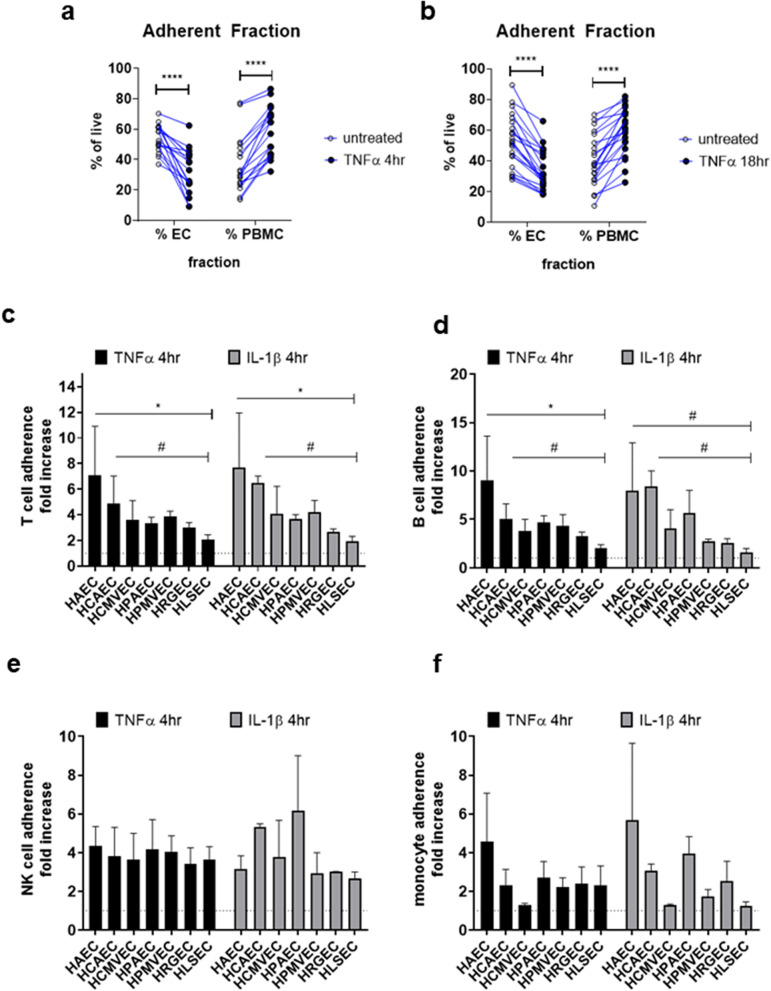
Figure 2.
Differential adherence of allogeneic PBMC to cytokine-activated endothelial cells. Endothelial monolayers were stimulated with TNFα (20 ng/mL) or IL-1β (20 ng/mL) for 4 h or 18 h. Stimulation medium was removed, and whole PBMC fractions were added at a ratio of 3 PBMC to 1 endothelial cell and allowed to adhere for 45 min. Nonadherent cells were removed by two washes with HBSS with Ca2+ and Mg2+, and adherent cells were detached by a third wash with PBS without Ca2+ and Mg2+ followed by treatment Accutase. Adherent cells were stained with an immunophenotyping panel and acquired by flow cytometry. (a) Endothelial cells and total PBMC as a percent of live cells in the adherent fraction is shown in the spaghetti plots, comparing untreated endothelial cells with (a) TNFα 4 h-treated EC and (b) TNFα 18 h-treated EC. Each pair represents a unique experiment (n = 21). ****p < 0.0001. (c) Adherence of T cells (gated on CD105neg CD3+) to endothelial cells (gated on CD11aneg CD105+) from different vascular beds after pre-activation with TNFα at 4 h (black bars) or IL-1β at 4 h (grey bars). #p < 0.1, *p < 0.05 comparing HAEC or HCAEC to HLSEC. (d) Adherence of B cells (gated on CD105neg CD19+) to endothelial cells (gated on CD11aneg CD105+) from different vascular beds after pre-activation with TNFα at 4 h (black bars) or IL-1β at 4 h (grey bars). #p < 0.1, *p < 0.05 comparing HAEC or HCAEC to HLSEC. (e) Adherence of NK cells (gated on CD105neg CD3neg CD19neg CD56+) to endothelial cells (gated on CD11aneg CD105+) from different vascular beds after pre-activation with TNFα at 4 h (black bars) or IL-1β at 4 h (grey bars). #p < 0.1, *p < 0.05 comparing HAEC or HCAEC to HLSEC. (f) Adherence of monocytes (gated on CD105neg CD3neg CD19neg CD14+) to endothelial cells (gated on CD11aneg CD105+) from different vascular beds after pre-activation with TNFα at 4 h (black bars) or IL-1β at 4 h (grey bars). #p < 0.1, *p < 0.05 comparing HAEC or HCAEC to HLSEC. Results are presented as the fold increase in the ratio of PBMC to endothelial cells as mean ± SEM (n = 3 unique EC-PBMC donor combinations).

