Figure 4.
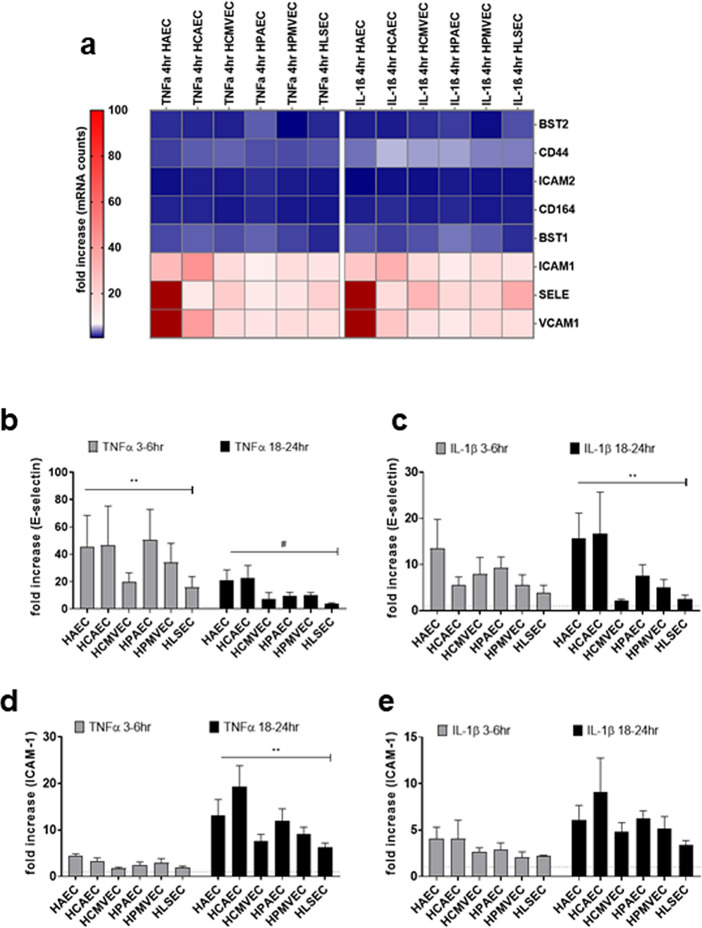
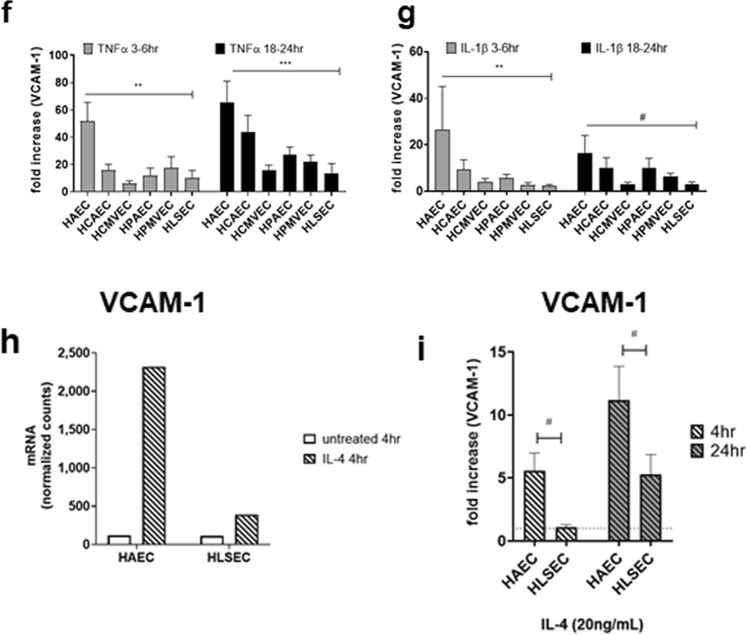
Adhesion molecule expression by cytokine-activated endothelial cells. (a) After 4 h activation with TNFα (20 ng/mL) or IL-1β (20 ng/mL), stimulated endothelial cells were lysed in RLT buffer, and mRNA for immune response genes was measured by nanostring. Absolute mRNA counts for endothelial adhesion molecule genes are presented in the heat map. (b, c) After 4 h or 18-24 h, stimulated endothelial cells were detached and TNFα (b) and IL-1β (c) induced cell surface E-selectin was measured by flow cytometry. Results are presented as fold increase in the median fluorescence intensity of cell surface E-selectin, normalized within each experiment to the untreated condition for each cell type.(d, e) After 4 h or 18-24 h, stimulated endothelial cells were detached and TNFα (d) and IL-1β (e) induced cell surface ICAM-1 was measured by flow cytometry. Results are presented as fold increase in the median fluorescence intensity of cell surface ICAM-1, normalized within each experiment to the untreated condition for each cell type. (f, g) After 4 h or 18-24 h, stimulated endothelial cells were detached and TNFα (f) and IL-1β (g) induced cell surface VCAM-1 was measured by flow cytometry. Results are presented as fold increase in the median fluorescence intensity of cell surface VCAM-1, normalized within each experiment to the untreated condition for each cell type. (TNFα and IL-1β 4 h, n = 4; 18-24 h, n = 5–6 donors per endothelial cell type). #p < 0.1, *p < 0.05, **p < 0.001 comparing HAEC and HCAEC to HLSEC by two way ANOVA followed by uncorrected Fisher’s LSD. (h) mRNA and (i) fold increase in the MFI of cell surface expression of VCAM-1 was measured on aortic HAEC and liver HLSEC endothelial cells stimulated with IL-4 (20 ng/mL) for 4 h or 24 h (n = 3 donors per endothelial cell type). Results are presented as mean ± SEM. #p < 0.1 comparing HAEC to HLSEC, by two way ANOVA and uncorrected Fishers LSD.


