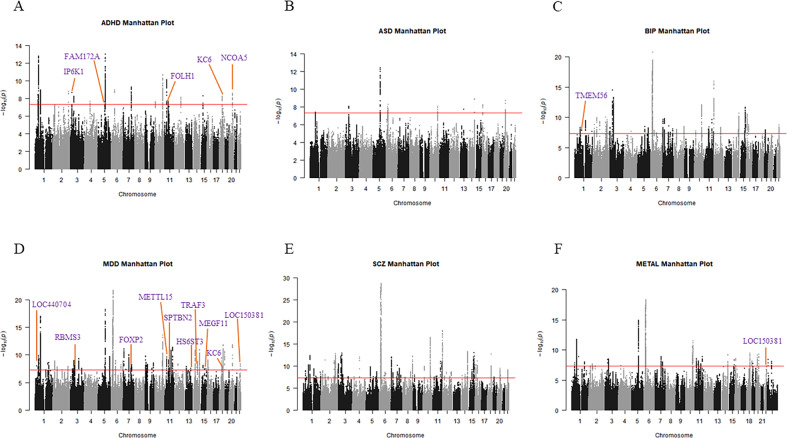
Fig. 1. Manhattan plots showing the association statistics for multi-trait joint analysis and meta-analysis of five neuropsychiatric diseases.
Manhattan plots of the susceptibility loci of five neuropsychiatric diseases: ADHD (A), ASD (B), BIP (C), MDD (D), SCZ (E), METAL (F). SNP locations are plotted on the x-axis according to their chromosomal position. The y-axis shows the −log10 of P values per SNP derived from the meta-analysis. The horizontal red line represents the genome-wide significance threshold of P value < 5 × 10⁻⁸. The purple text shows the closest gene to the most prominent SNPs at each novel locus.

