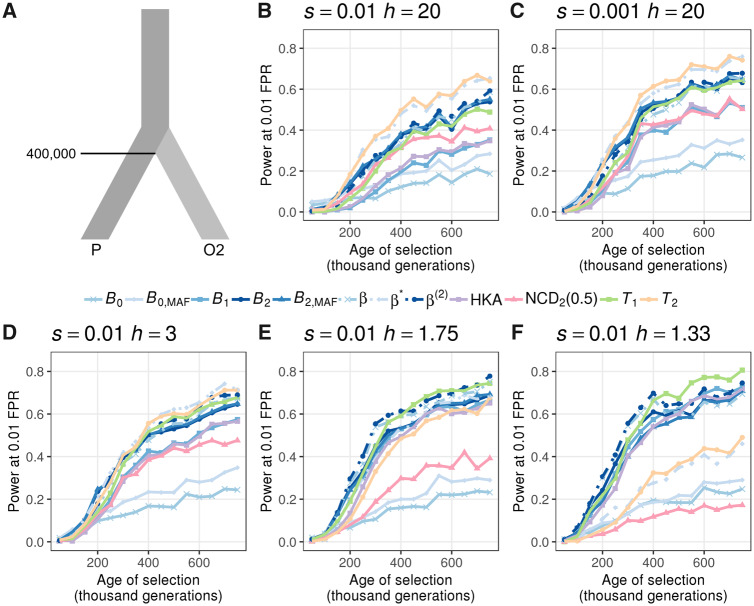
Fig. 3.
Ability to detect balancing selection for different heterozygote advantage scenarios. (A) Demographic model relating the ingroup (P) and outgroup (O2) populations, with one sample from O2 used as the outgroup sequence. (B–F) Powers at a 1% false positive rate (FPR) for each statistic as a function of age of the allele undergoing balancing selection for different selection (s) and dominance (h) coefficients. The scenarios considered are (B) s = 0.01 with h = 20, (C) s = 0.001 with h = 20, (D) s = 0.01 with h = 3, (E) s = 0.01 with h = 1.75, and (F) s = 0.01 with h = 1.33. Note that the equilibrium frequencies for panels (D), (E), and (F) are 0.4, 0.3, and 0.2, respectively.

