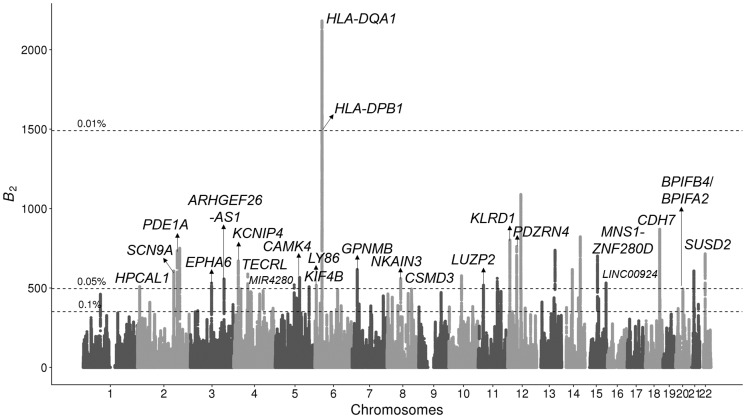
Fig. 4.
Manhattan plot displaying B2 scores across the 22 human autosomes for which the bonobo genomic data were mapped, with the candidates scoring in the top 0.05% annotated. RNA genes are annotated with smaller fonts. Horizontal dotted lines represent cutoff scores for the top 0.1%, 0.05%, and 0.01% across the genome. Peaks higher than 0.05% cutoff but without annotations do not have neighboring protein-coding regions within a 250-kb radius.

