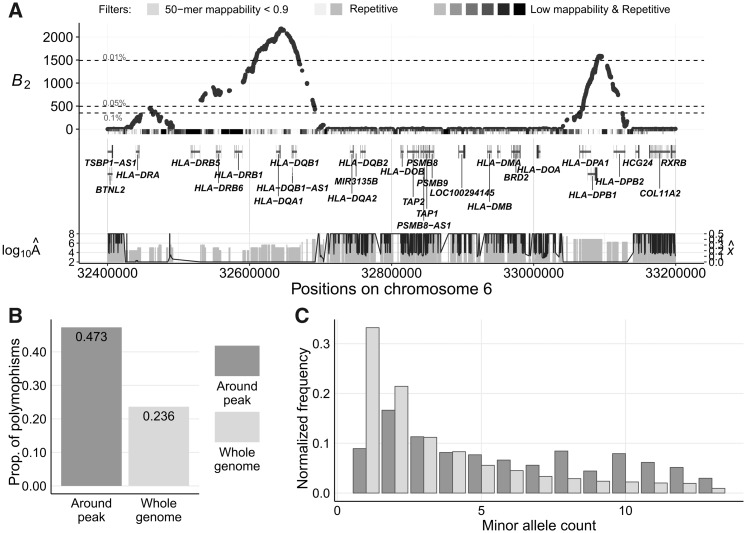
Fig. 5.
Evidence for balancing selection on MHC-DQ and MHC-DP genes in bonobos. Note that the plotted gene names are based on the annotations of human hg38 reference genome. (A) B2 scores across the genomic region on chromosome 6 surrounding the MHC-DQ and MHC-DP genes. The gray bars directly under the B2 scores represent the masked regions, as well as the features in these regions. The darker the shade, the greater number of types of repetitive sequences (e.g., RepeatMasker mask, segmental duplication, simple repeats, or interrupted repeats) overlapping the region. Vertical gray bars below display the estimated equilibrium minor allele frequency for each maximum likelihood ratio B2, and the black line traces the value for the respective inferred footprint size (B) Proportion of informative sites that are polymorphic in the 800-kb region centered on the peak compared with the whole-genome average. (C) Minor allele frequency distribution in the 500-kb region centered on the peak compared with the whole-genome average.

