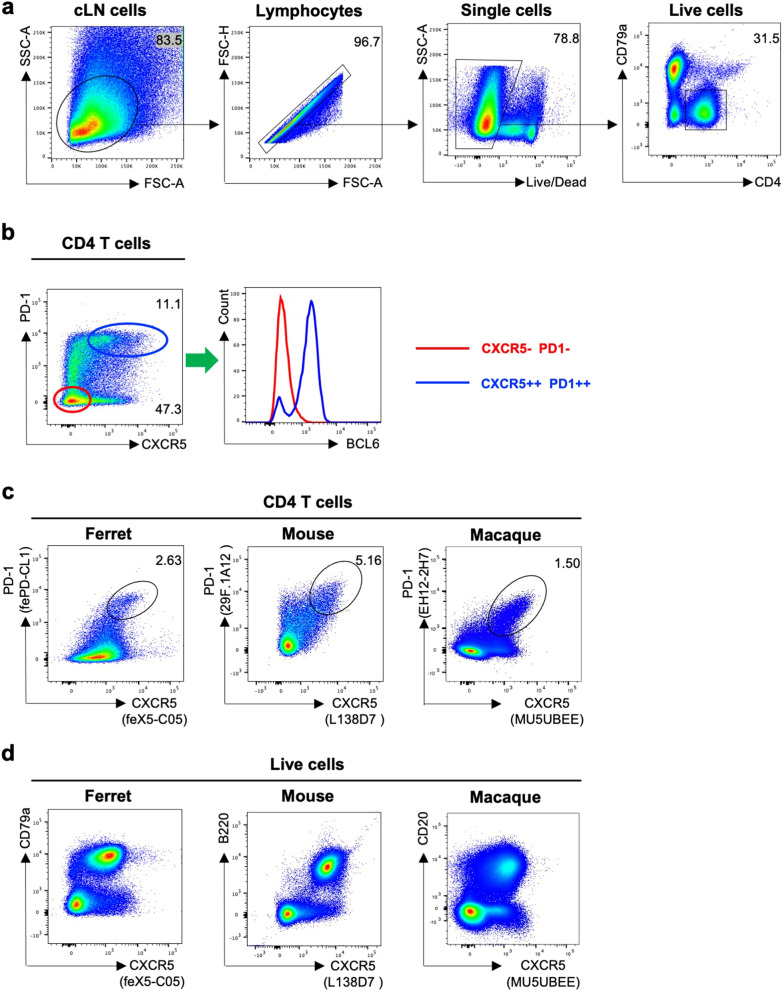
Figure 4.
Identification of Tfh cells in lymph node cells from influenza infected ferrets. (a) Gating strategy to identify CD4 T cells in the ferret LN. Lymphocytes were identified by forward scatter area (FSC-A) and side-scatter area (SSC-A). Doublets were excluded by gating on single cells as determined by FSC-A versus FSC-H, live cells were identified by viability dye exclusion, CD4 T cells were identified as CD4+ CD79a−. For each step, the parental population is indicated above the plot. (b) Representative plots of ferret CD4 T cells stained with anti-BCL 6 (clone K112-91), anti-ferret CXCR5 (clone feX5-C05) and anti-ferret PD-1 (clone fePD-CL1) antibodies. The BCL6 expression of CXCR5++ PD-1++ CD4 T cells (Tfh, blue oval) were compared with CXCR5− PD-1− CD4 T cells (non-Tfh, red oval) cells. The parental population is indicated above the plot. (c) Representative plots of CD4 T cells from influenza-infected ferret, mouse and macaque LNs stained with species-appropriate CXCR5 and PD-1 antibodies (mouse, clones L138D7 and 29F.1A12 respectively; macaque, MU5UBEE and EH12.2H7 respectively). The parental population is indicated above the plot. (d) Representative plots of live lymphocytes from influenza-infected ferret, mouse and macaque LNs stained with their respective CXCR5 antibodies as well as CD79, B220 and CD19 antibodies. The parental population is indicated above the plot.

