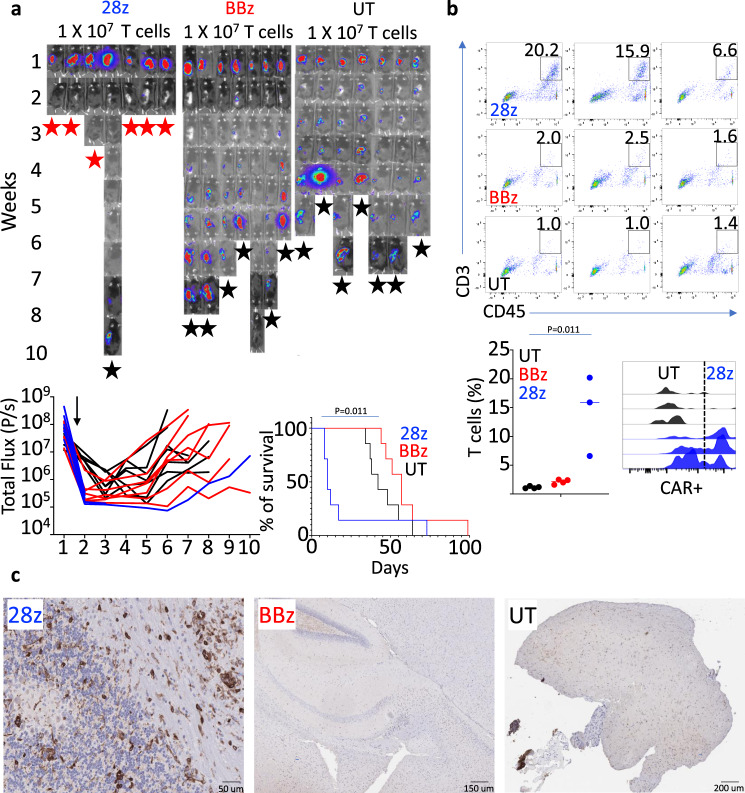
Fig. 1. GD2-28z murine CAR-T cells cause fatal neurotoxicity in immunocompetent mice.
a Bioluminescence images from a survival study of NB9464DGD2+Luc+ tumor-bearing mice treated with a 5-day course of chemotherapy followed 72 h later with GD2-28z (28z), GD2-BBz (BBz), or untransduced (UT) murine T cells. Animals were injected intravenously with GD2-28z, GD2-BBz, or UT murine T cells (1 × 10⁷ cells/mice) at 72 h post completion of chemotherapy. Six out of seven animals treated with murine GD2-28z CAR-T cells experienced significant toxicity (seizure, hunched, and immobile) 5–8 days after CAR-T infusion and were either immediately sacked or were found dead. The remaining animals died of tumor growth at various timepoints with an average of 6 weeks post start of chemotherapy, except for one animal in the GD2-BBz group. (Red star—death from neurotoxicity, black star—death from tumor). Lower left: Individual bioluminescence intensity of NB9464DGD2+Luc+ tumor-bearing immunocompetent mice starting from the week before the administration of chemotherapy and murine GD2-28z, GD2-BBz CAR-T, or UT cells. All GD2-28z animals, except for one, were found dead or euthanized for evidence of severe neurotoxicity. The black arrow points to the time of CAR-T or UT T-cell injection. Lower right: Kaplan–Meier survival graph for the survival study of animals treated with murine GD2-28z, GD2-BBz, or UT T cells. b, upper and lower left: Flow cytometry dot plots and T-cell frequency from single-cell dissociated brain tissue from groups of mice treated similar to groups used in the survival study of Fig. 1a, but who were euthanized upon the onset of neurological symptoms in the GD2-28Z-treated group. Lower right: Histogram representing CAR-T cells identified among CNS-infiltrating CD3+ T cells using an anti-Fab antibody. c Immunohistochemical analysis of murine CD3 (brown) in brain tissue of CAR-T-cell-treated animals. n = 7 mice (28z, BBz, or UT) (a), n = 4 mice (28z, BBz or UT) (b). Gehan–Breslow–Wilcoxon test (a). Two-tailed t test (b). Experiment (b) performed independently from (a). The data shown are representative of three individual mice from each group, remaining images are included in the Supplementary Information (c). Source data are provided as a Source Data file.

