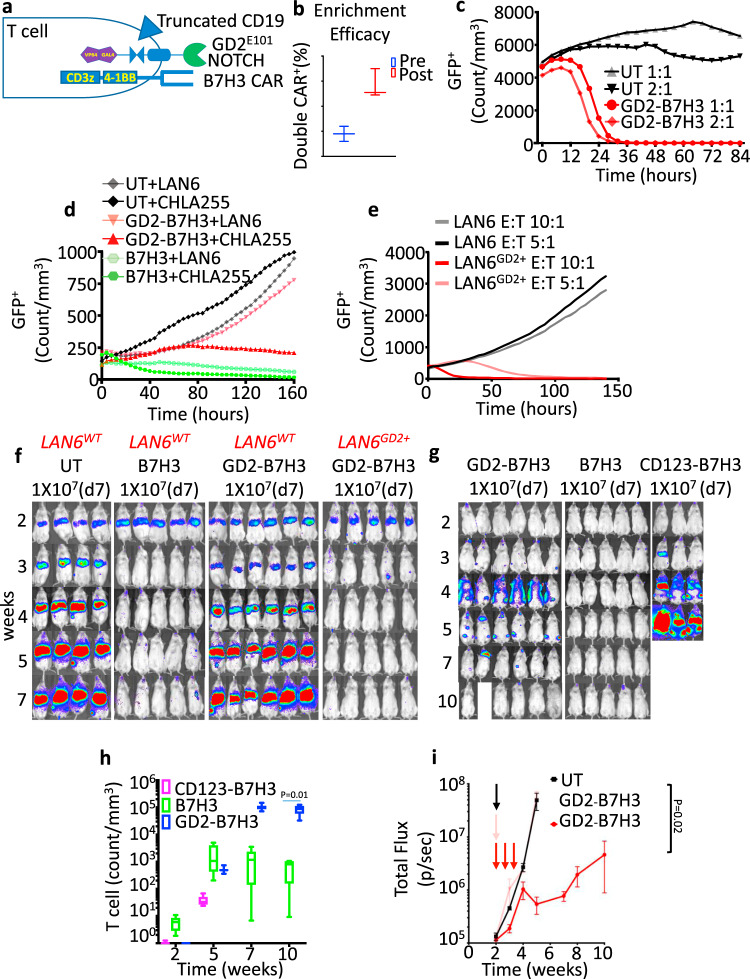
Fig. 5. Enrichment of GD2-B7H3 T cells improves efficacy against NBL.
a Schematic of GD2-B7H3 T cells engineered to constitutively express truncated CD19. Double-positive T cells for SynNotch and CAR constructs can be enriched post transduction via CD19 beads and anti-Fab beads to achieve a higher yield. b Average and range of double-positive (CD19, GD2 SynNotch) GD2-B7H3 T cells pre- and post-enrichment as measured by flow cytometry. c Kinetics of cytotoxicity of UT and enriched GD2-B7H3 T cells using live-cell imaging (enumeration of GFP+ tumor cells) against CHLA255 cells at indicated E:T ratios. d Kinetics of cytotoxicity of UT, B7H3 CAR-T, and enriched GD2-B7H3 T cells using live-cell imaging (enumeration of GFP+ tumor cells) against GD2+ CHLA255 and GD2− LAN6 cells at 1:1 E:T ratio. e Kinetics of cytotoxicity of GD2-B7H3 T cells using live-cell imaging (enumeration of GFP+ tumor cells) against wild-type LAN6 (GD2 negative) and LAN6GD2+ cell lines at indicated E:T ratios. f Bioluminescence images of LAN6 and LAN6GD2+ metastatic tumor-bearing mice treated with i.v. injection of 1 × 10⁷ enriched GD2-B7H3, UT, or B7H3 CAR-T cells. Surviving mice were followed for a minimum of 100 days after injection of the NBL cell line. g Bioluminescence images of CHLA255 tumor-bearing mice treated with i.v. injection of 1 × 10⁷ enriched GD2-B7H3, CD123-B7H3, or B7H3 CAR-T cells 7 days post NBL cell line injection. Surviving mice were followed for a minimum of 100 days post-tumor inoculation. h Boxplot data of peripheral blood T-cell count over time in mice (from Fig. 4g) treated with enriched GD2-B7H3, CD123-B7H3, or B7H3 CAR-T cells. i Summary bioluminescence intensity data from CHLA255 tumor-bearing mice (Supplementary Fig. 8) treated 14 days after tumor inoculation with three doses of i.v. injection of UT or enriched GD2-B7H3 T cells (1 × 10⁷ cells/mouse/injection) versus one-time i.v. injection of GD2-B7H3 T cells, mean for a minimum of four replicate (c–e), min to max (b). Whiskers were calculated using the Tukey method. Boxes extend from 25th to 75th percentiles, and lines in the middle of the boxes represent the median (h), mean ± SD (i). Two-tailed t test (h, i). n = 6 mice (GD2-B7H3 (LAN6, CHLA255)), n = 5 (B7H3(LAN6, CHLA255)), n = 4 (UT), n = 3 (CD123-B7H3). Individual BLI and source data are provided as a Source Data file.

