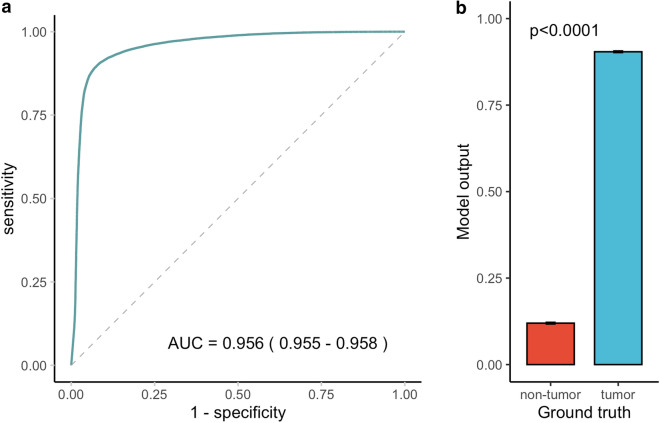
Figure 3.
Performance of the tumor tile classification model on the external test set. The AUROC for tumor tile classification was 0.956 (95% CI 0.955, 0.958) on the external test set (a). Model outputs differed significantly between tiles with a ground truth of tumor versus non-tumor (p value < 0.0001) (b). *95% CI for AUC is shown in parentheses in the ROC plot. **Error bars represent 95% CI in the bar chart. The p value was computed using the Wilcoxon rank sum test. AUC, area under the ROC curve; CI, confidence interval; ROC, receiver operating characteristic.

