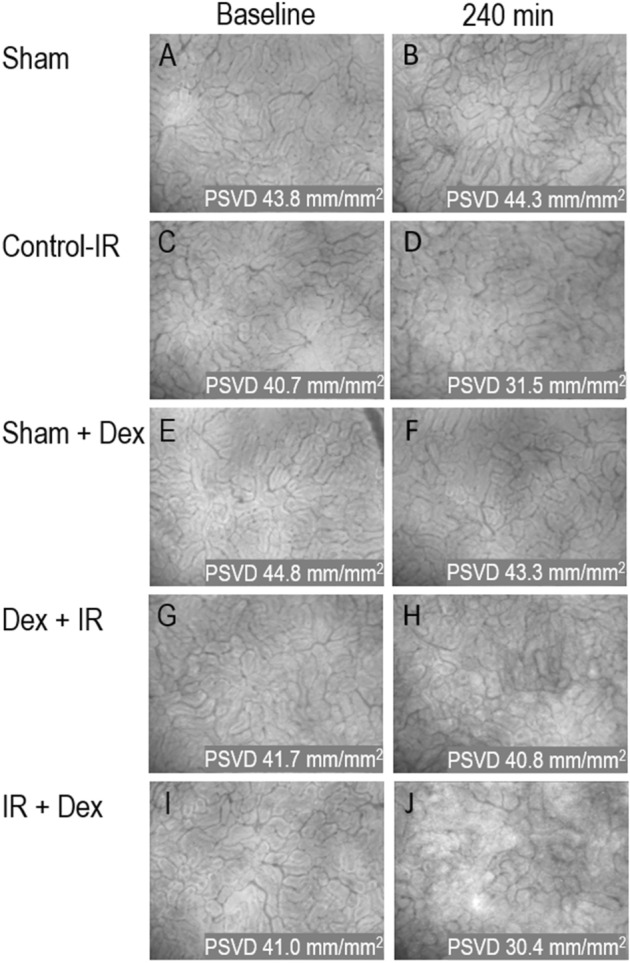
Figure 2.

Microcirculation images of the renal surface from a sidestream dark field video microscope at baseline and 240 min after ischemic kidney reperfusion. (A, C, E, G, I) baseline of the five groups. (B, D, F, H, J) At 240 min after ischemic kidney reperfusion. At 240 min, perfused small vessel density was lower in the Control‒IR and IR‒Dex groups than in the Sham group. Sham indicates sham operation; Control‒IR (ischemia/reperfusion), left kidney ischemia for 60 min and reperfusion; Dex (dexmedetomidine)‒Sham, sham operation and infusion of dexmedetomidine; Dex‒IR, pre-ischemia infusion of dexmedetomidine 30 min before left kidney ischemia; IR‒Dex, post-ischemia infusion of dexmedetomidine 30 min after reperfusion of the left ischemic kidney. PSVD, perfused small vessel density.
