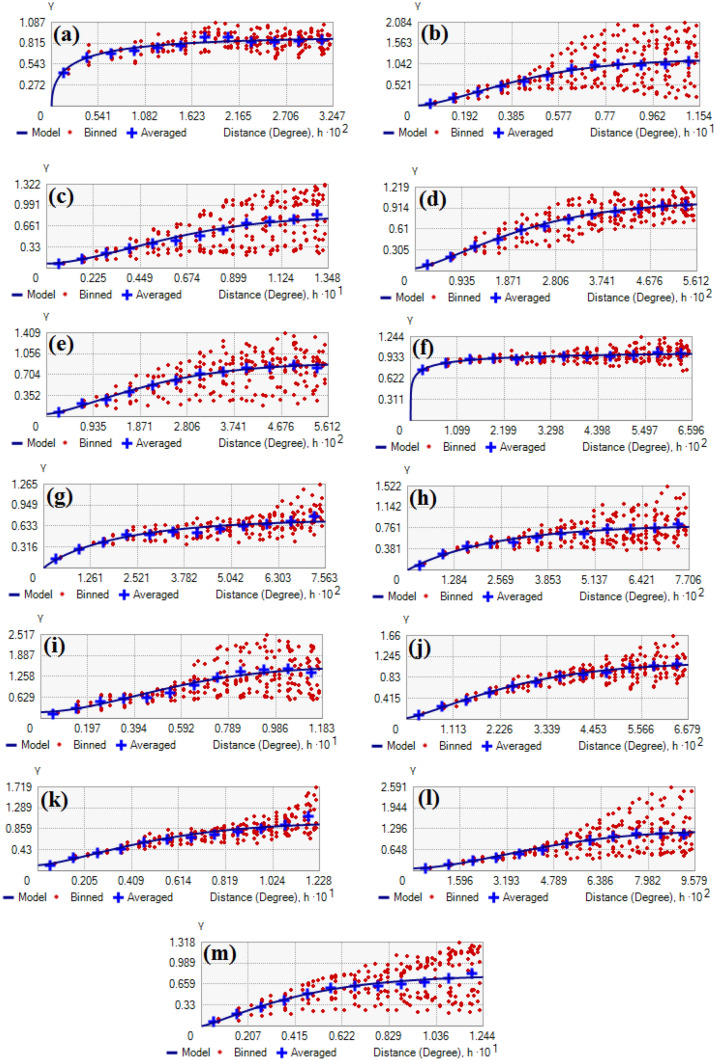
Figure 5.
Result of semivariogram. (a) Distance to street, (b) Pressure, (c) Wind speed, (d) Humidity, (e) Temperature, (f) Distance to park, (g) PM 2.5, (h) PM 10, (i) SO2, (j) NO2, (k) CO, (l) O3, and (m) Rainfall. This map was generated using the tool of ArcGIS 10.3 (ESRI, Redlands, CA, USA, http://www.esri.com).

