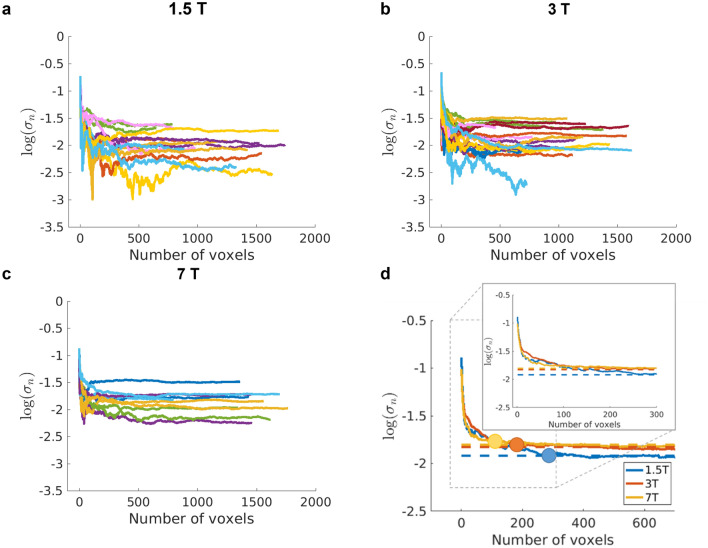
Figure 4.
Results of the Weisskoff test: standard deviation over time of the mean resting signal as a function of the number of voxels averaged (see Eq. 1) at 1.5 T, 3 T and 7 T (a), (b) and (c), respectively. The voxels added were located in the middle of the cortex and the curves here correspond to TE = T2*GM at each field. Each colour represents a subject, one line per hemisphere. The differences between the physiological noise levels are not significantly different (p = 0.49) between field strengths. (d) The average of the Weisskoff curves over subjects for the three fields studied. The circles correspond to the point in which the curve deviates from the plateau corresponding to the noise level where the physiological noise dominated regime has been reached (dashed lines with same colour-coding as for static field strength). The inset corresponds to the result for the first 300 voxels (without the circles).

