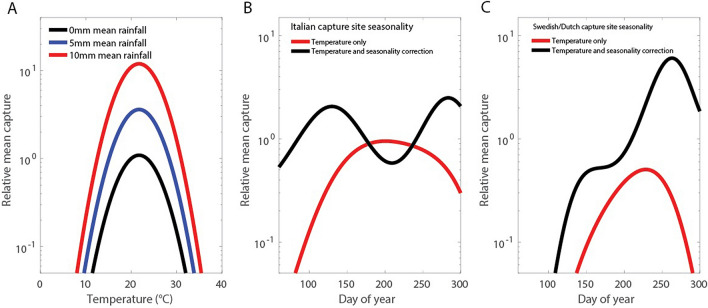
Figure 2.
Expected midge catch size. Relative effect on midge catch size of varying mean daily temperature, mean precipitation over previous week, and catch day of year (in each case predictor variables being fixed). Left (A): Relative expected catch sizes for a range of temperatures and mean precipitation. Middle (B): Smoothed seasonal variation at the Italian sampling site if driven by observed local temperatures only (red curve) and with sine and cosine seasonality correction (black curve). Right (C): Smoothed seasonal variation at the Swedish and Dutch sampling sites if driven by observed local temperatures only (red curve) and with sine and cosine seasonality correction (black curve).

